Markets and Economy: The Controlled Burn
by Tim Doyle, Chief Investment Officer, CFP®, MBA
Back in March of 2012, a police dispatcher in Jefferson County, Colorado, took a call from a resident south of Conifer who reported seeing smoke moving in the direction of a residential area. Their exchange – later released via 911 tapes – went something like this:
Caller – “It wasn’t a prescribed burn, was it?”
Dispatcher – “It was – but it’s not prescribed any further”
You see, four days earlier, the Colorado State Forest Service had ignited 50 acres of Denver Water land as part of a watershed restoration project. Everything had seemingly gone to plan – until the winds came. On March 26th, wind gusts reached 55-60 miles per hour and smoldering embers leapt the control line. Before it was all said and done, the Lower North Fork Fire had burned about 4,100 acres, destroyed over 20 homes and, tragically, killed three area residents before it was contained in early April.
I recall this event somewhat vividly because the concept of ‘controlled’ or ‘prescribed’ burns was entirely new to me at the time given the fact that I was an east coast transplant. The idea that you set an area on fire to either restore it or protect the area from future fire danger was foreign to me. Now, here we are in 2026 and as I survey the domestic economic landscape, I can’t help but be reminded of the controlled-burn concept. On one hand, you have the federal government making policy decisions such as military action in Iran, tariff & trade, taxes, deficit spending and more. Each of these policy decisions are like lighting little inflationary fires. We then have the Federal Reserve who serves as a containment crew, of sorts, tasked with keeping the flames of inflation in-check through policy decisions of their own. With the Iran war reaching the six month mark, we are at a crucial juncture where investors are about to learn whether or not the Federal Reserve, under new leadership of Kevin Warsh, is up to the task and keep the flames of inflation from jumping containment and spreading into other areas of the U.S. economy.
Six Months in the Strait
The war between the United States and Iran began back on February 28, 2026 and – six months later – the single most consequential economic impact from this conflict isn’t found on a battlefield map, but through a shipping lane.
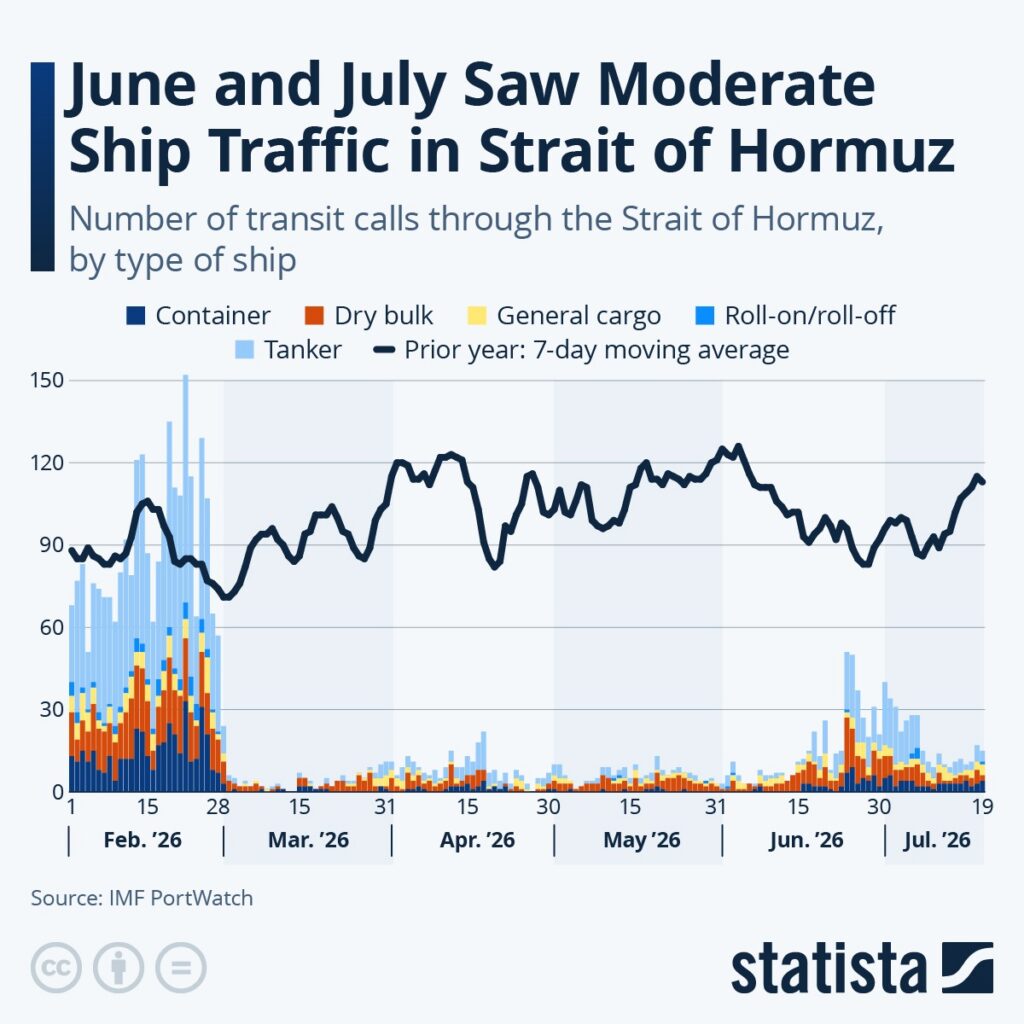
Before the war, roughly 20 million barrels of petroleum products moved through the Strait of Hormuz each day. That equates to about one-fifth of global petroleum supply. Prior to the war, between 125 and 130 commercial vessels made the transit through the Strait each day. On August 27th, only seven did. The chart below helps to illustrate the vast change in shipping activity before and after the war.
As you can imagine when 20% of the world’s oil supply is suddenly cut, prices have fluctuated greatly since the onset of the war. In the days and weeks immediately following the first U.S. strikes in Iran, crude oil spiked from roughly $60 per barrel to over $130 per barrel. Then, as hints of peace talks and cease fires emerged, prices have since settled around $90 per barrel for oil, and around $4.15 per gallon for regular unleaded gasoline according to AAA.
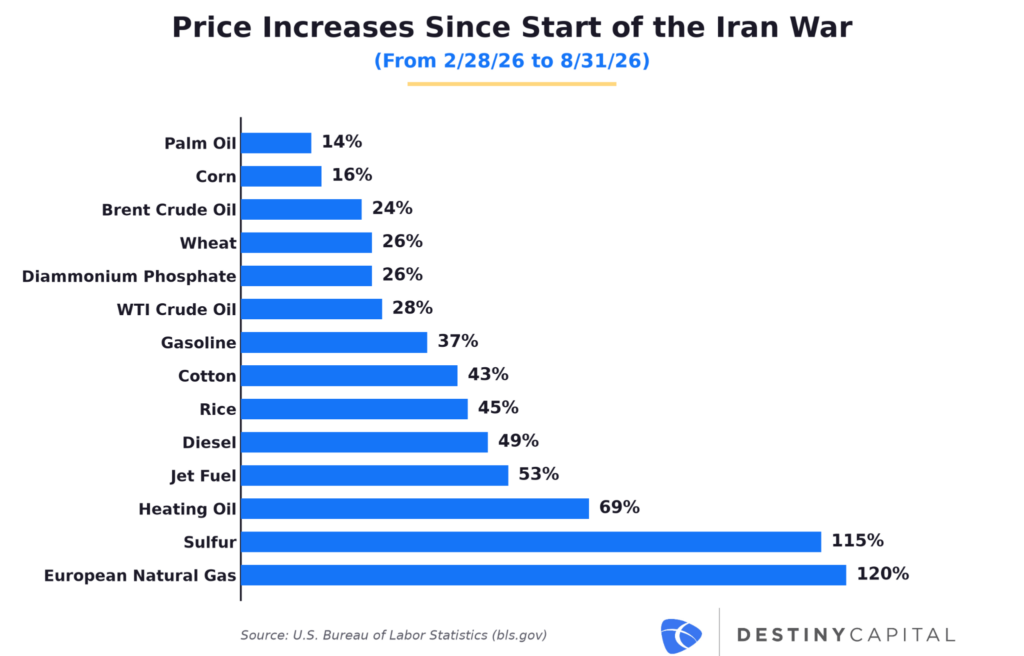
However, the price increases didn’t stop with oil and gas. The Strait of Hormuz is also crucial for the transport of fertilizer, and an April Farm Bureau survey revealed that 70% of farmers could not afford all of the fertilizer they needed. Therefore, farmers either need to either charge more for their crop due to fertilizer price increases or they need to cut production because there simply isn’t enough fertilizer to support their crop. Regardless, that has pushed prices higher for key crops like corn, wheat and rice (and many other key commodities) as you can see in the graph below.
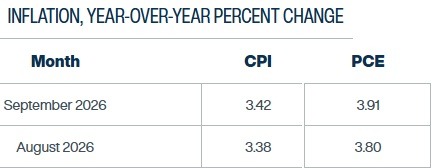
When commodity prices surge like this, higher aggregate prices for consumers are sure to follow, and that’s what we’ve seen with the Consumer Price Index fluctuating between 4.2% in May and 3.3% in July. Moving forward, prices are expected to remain elevated as seen in the projections below provided by the Cleveland Fed.
This all sets the stage for the Federal Reserve Fire Crew who are tasked with containing this inflationary blaze, and investors are starting to get a better sense of what the Fed’s policy reaction is going to be in the weeks and months ahead.
The Containment Crew – Rate Hikes Are Coming
As I’ve written many times in these monthly letters, investors tend to parse every word uttered by each sitting Fed Chairman, and this was certainly the case for Kevin Warsh’s commentary during the Fed’s Jackson Hole symposium in late August. I had the following takeaways based on direct quotes from Warsh:
Quote: “The Fed’s price stability objective of 2% is a firm, fixed target”
Takeaway: Some investors insinuated that, with Warsh at the helm, the Fed might tolerate above-target inflation or even a range, and Warsh quelled any such rumors by reinforcing 2% as a firm, fixed target.
Quote: “While this summer’s PCE and CPI readings were better than expected, they do not tell me that the underlying trends have meaningfully improved.”
Takeaway: Yes, some inflation readings came in better than consensus estimates, but Warsh does not consider this meaningful progress towards reaching the Fed’s 2% target.
Quote: “We must be confident that underlying inflation is moving to our objective, clearly and at sufficient speed. Otherwise, we have work to do.”
Takeaway: the “we have work to do” line was the quote that many investors believed signaled future rate hikes by the Fed.
To quell the inflationary fire, the Fed really only has one primary tool at their disposal – interest rate policy. When the Fed raises interest rates, they do so with the hope that it will slow economic growth and reduce aggregate demand which would, ideally, lower prices across the economy. As it stands now, investors are almost evenly split as to whether the Fed will raise interest rates by 25 basis points during their September 16th meeting as seen in the graph from the CME Group’s FedWatch Tool.
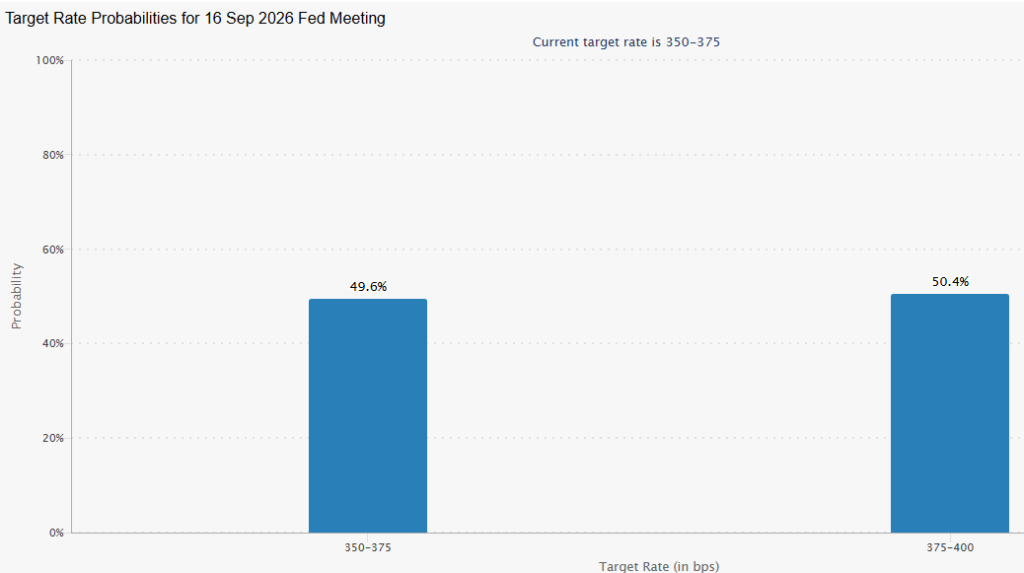
When looking out over the remainder of the year, the probability of at least one 0.25% rate hike jumps to 83%. So the question isn’t if a rate hike will happen, but when. So, what does this mean for investors? Are we going to have another 2022-style bond market meltdown? Will stocks collapse under the pressure of higher interest rates?
When addressing those questions, I think it’s important to remember that we are at a very different starting point than we were back when the Fed started raising interest rates in the wake of the COVID-19 recovery. Back then, the effective fed funds rate was around 0.08%, so the rapid jump from a rate of nearly 0% to roughly 5.3% caused considerable pain for many fixed income investments. Rapidly rising rates also caused pain for many small cap companies who saw the cost of borrowing rise significantly in a short period of time. Given that rates are at a much higher starting point than they were back in early 2022, I expect the impact to be somewhat muted – at least in the short term.
At Destiny Capital, we also believe it’s important to diversify across different types of fixed income investments not only by issuer (government, corporate, municipal, securitized, etc) but across regions, credit risks, and duration. While higher rates could signal challenges for certain types of bonds, it may provide an opportunity in other areas of credit markets. For example, in Direct Lending (private credit) markets, loans are floating rate relative to short-term treasury rates. This means that there is virtually no interest rate risk and – if anything – as interest rates move higher, investors are rewarded through higher yields generated by these types of private credit investments.
As such,the immediate concerns I have isn’t centered around whether or not higher interest rates will negatively impact stock and bond markets. It has to do with whether or not the Fed will actually be successful in reigning-in inflation. When discussing inflation, investors often focus on year-over-year inflation figures such as “CPI rose 3.4% year-over-year in July.” However, I urge consumers and policymakers to focus on the cumulative effect of higher prices over time, and the chart below helps to illustrate this by showing how far off ‘glide path’ inflation has been since early 2020.
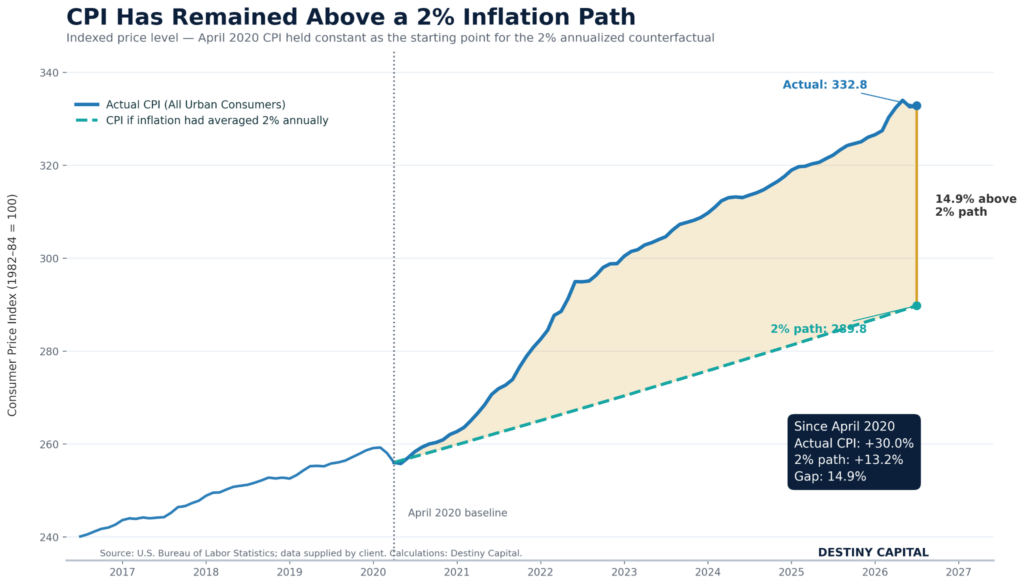
Rising prices have been incredibly destructive for consumers – particularly those with limited means to absorb them. The unfortunate fact is that, as we all know, interest rate policy is an inexact science and the most immediate impact on inflation may come with a resolution that reopens the Strait of Hormuz that begins to immediately lower commodity prices across the global economy. That would remove one key element that is fanning the flames of inflation and would certainly make life easier for the Federal Reserve as they attempt to keep the embers from spreading even further.
Important note and disclosure: This article is intended to be informational in nature; it should not be used as the basis for investment decisions. You should seek the advice of an investment professional who understands your particular situation before making any decisions. Investments are subject to risks, including loss of principal. Past returns are not indicative of future results. Advisory services offered through Destiny Capital Corporation, an Investment Adviser registered with the U.S. Securities & Exchange Commission.
2024 YCharts, Inc. All Rights Reserved. YCharts, Inc. (“YCharts’) is not registered with the U.S. Securities and Exchange Commission (or with the securities regulatory authority or body of any state or any other jurisdiction) as an investment adviser, broker-dealer or in any other capacity, and does not purport to provide investment advice or make investment recommendations. This report has been generated using data manually input by the creator of this report combined with data and calculations from YCharts.com and is intended solely to assist you or your investment or other adviser(s) in conducting investment research. You should not construe this report as an offer to buy or sell, as a solicitation of an offer to buy or see, or as a recommendation to buy, sell, hold or trade, any security or other financial instrument. THE IMPORTANT DISCLOSURES FOUND AT THE END OF THIS REPORT (WHICH INCLUDE DEFINITIONS OF CERTAIN TERMS USED IN THIS REPORT) ARE AN INTEGRAL PART OF THIS REPORT AND MUST BE READ IN CONJUNCTION WITH YOUR REVIEW OF THIS REPORT. Disclosure – YCharts
Share this
Stay Ahead with Smart Investments
Learn how to invest wisely and minimize risks to protect your retirement savings.

Achieve Your Retirement Goals
Get personalized advice to meet your retirement goals. Book your call with Destiny Capital now.