Markets and Economy Update – June 2022
Decades ago during my high school years, my somewhat myopic world tended to revolve around three subjects: school, sports and girls (most likely in reverse order). When it came to athletics, it was football in the fall, hoops in the winter and lacrosse in the spring. Finally, during my senior year, I decided to solely focus on the sport where a spindly yet spry, 5’10”, 155 pound kid could have any real, lasting success – lacrosse. Decades later, as many of us tend to do, there have been times where I have gathered with old buddies with Bruce Springsteen’s song “Glory Days” playing in the background as we fondly reminisce about our old sports-related triumphs and tragedies.
During these nostalgic trips down memory lane, I noticed one common theme that I’ve learned is not unique to me. In hindsight, I always seemed to recount the losses much more acutely than any triumphs (and, yes, there were a few). I remember the missed shot. I recall with vivid clarity kneeling and watching as our opponent celebrated on the field during a playoff elimination game.
This selective mindset rings somewhat true when thinking about behavioral finance and Kahnenam & Tversky’s 1979 theory around the concept of loss aversion.
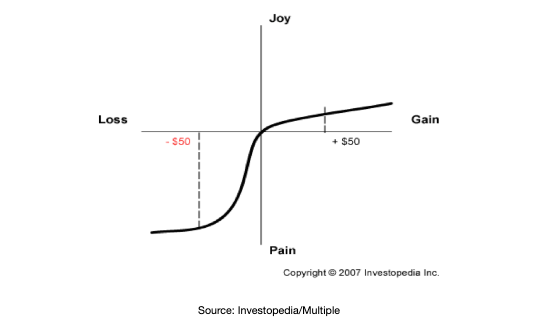
This theory suggests that, as illustrated in the chart above, people feel the pain of loss two times greater than the joy experienced from an equivalent gain. In short, the pain experienced in losing $50,000 is far greater than any joy experienced in gaining that same $50,000. This theory might help to explain why the painful losses of my youth are so vividly etched into my long-term memory relative to similar, dramatic wins.
For investors, and with the concept of loss aversion in mind, the first half of 2022 has been excruciatingly painful – and for good reason. During this timeframe, investors have experienced a six month slog that has resulted in the following year-to-date (YTD) returns of key asset classes, including: S&P 500 -20%, Nasdaq -29%, Small Caps -23.4%, Emerging Market Equities -17.5%, International Equities -19.3%, US REIT -19.2%, Aggregate Bonds -10.3%, High Yield Bonds -16.9%, Investment Grade Corporate Bonds -14%, US Treasuries -9.6%. As Martha and the Vandellas sang in their 1965 hit song, there is “nowhere to run to, baby, nowhere to hide.”
As long-term investors, we are used to equity shocks and navigating stock market volatility. As we have covered briefly in previous letters, what is so unusual about 2022 is the volatility investors have endured in bond markets. Below, you will see a chart that highlights the calendar year returns (gray bars) for the Bloomberg U.S. Aggregate Bond Index along with the intra-year decline experienced, as illustrated by the red dots.
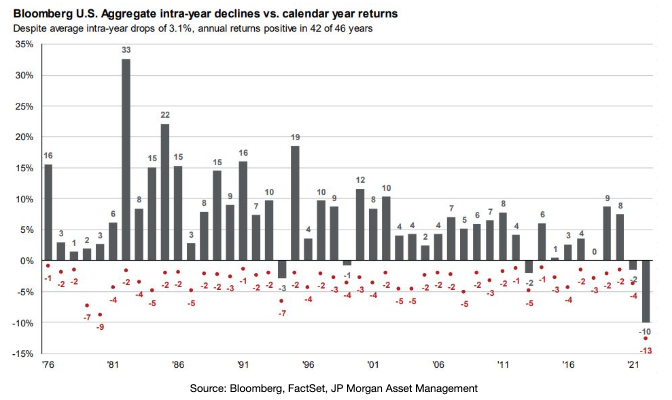
Over the past 46 years, the Agg Bond Index has experienced an average intra-year drop of -3.1% from peak to trough, yet annual bond returns have been positive in 42 of the past 46 calendar years. This chart also clearly shows how dramatic and unprecedented bond market performance has been in 2022, as the intra-year decline of -13% is far below even the worst bond market drawdowns experienced in the late 1970s.
Simply put, this bond market volatility has been unprecedented. Given that many long-term investors utilize bonds as a hedge against equity volatility, this makes investing in 2022 particularly unusual and painful, to date.
How Did We Get Here?
At a very basic level, markets have largely reacted to two key factors in 2022: rising inflation and the Fed’s response. Many have begun to question whether or not the Fed botched policy decisions as the U.S. economy crawled its way out of the pandemic. In 2021, economists saw indications that inflation was heating up, but the Fed largely viewed these emerging pressures as transitory and believed that supply chains would inevitably balance supply with demand as COVID-related restrictions were lifted and life returned to a post-pandemic normal.
However, three things happened along the way that most economists and investors (and probably the Fed) didn’t include in their base case for 2022: the Omicron variant, China’s strict COVID lockdown and Russia’s invasion of Ukraine.
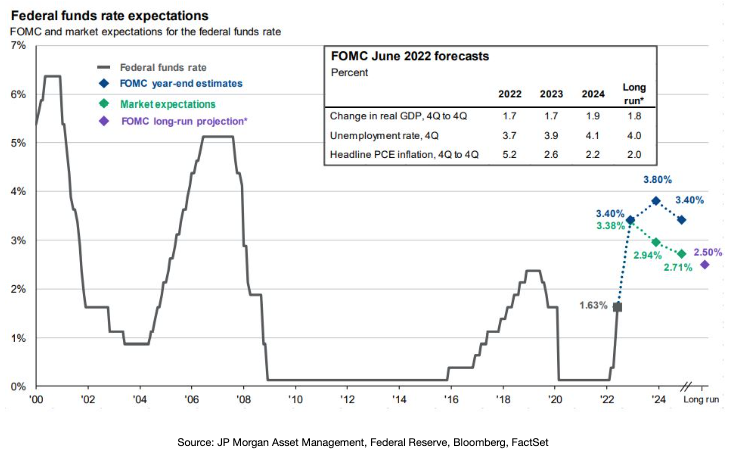
Each of these factors have both exacerbated inflation and extended its duration, causing the Fed to raise rates much more aggressively than initially planned. Over the past several months, the Fed raised the fed funds target rate 25bps in March, 50bps in May, and 75bps in June. Most prognosticators expect that the Fed will raise rates yet another 75bps in July with a year-end interest rate target of 3.40%, as illustrated in the chart below where the blue diamonds represent Fed year-end estimates.
Is the Fed’s aggressive strategy working? Clearly, it will take much more time to fully flesh out an answer to that question, but there are some early indications that inflation may be starting to roll over. As we have written before, interest rate hikes are a blunt instrument tool designed to do one thing: kill aggregate demand. To do this, the Fed must create an economic environment just scary enough to change consumer behavior and decrease aggregate demand, but only to a point. Talk about walking a tightrope, right?
Has the Fed been successful in frightening consumers? Based on recent surveys, the answer to that question would be a resounding “yes”. As seen in the chart below, Consumer Sentiment fell to 50.0 in June, the lowest reading in over 50 years. To me, these results are somewhat astounding given the magnitude of some of the economic shocks and deep recessions experienced over the past 5 decades.
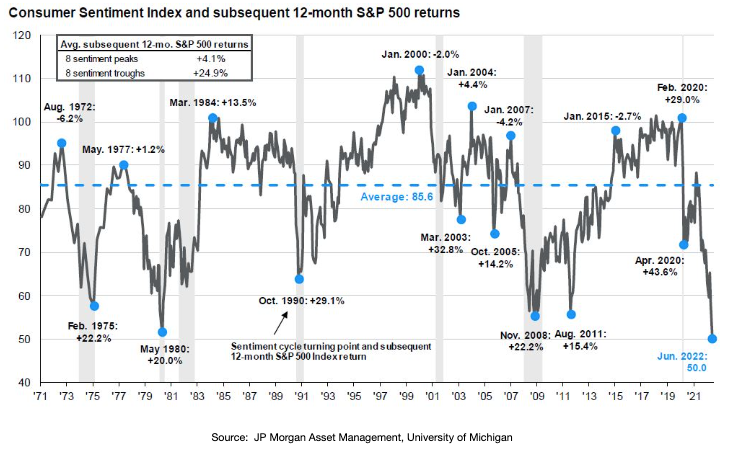
Naturally, consumer sentiment is impacted by more than just Fed monetary policy, but this chart gives us a glimpse into the mindset of a key component of the U.S. economy that makes up over two-thirds of U.S. GDP.
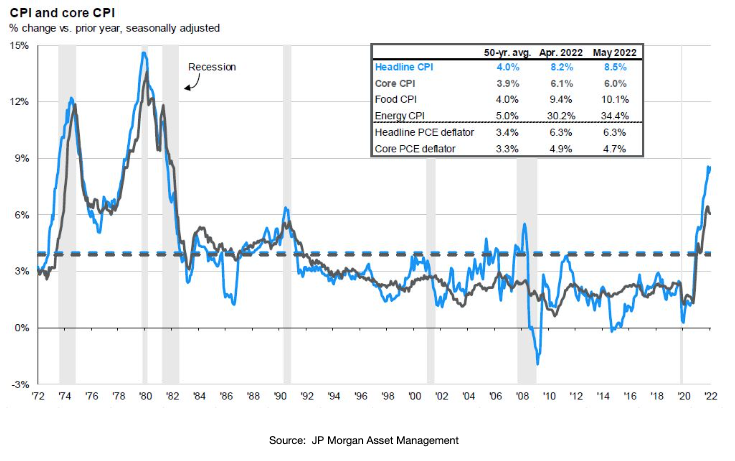
The question then becomes, is the Fed’s policy working? Are we seeing inflation plateau or even reverse course? Well, as we have mentioned in previous letters, the Fed’s favorite inflation measure is the PCE deflator. In the June 30th PCE release, we saw that Headline PCE in May held steady at 6.3% while Core PCE, which excludes volatile food and energy inputs, came in at 4.7%, slightly below the April reading of 4.9%.
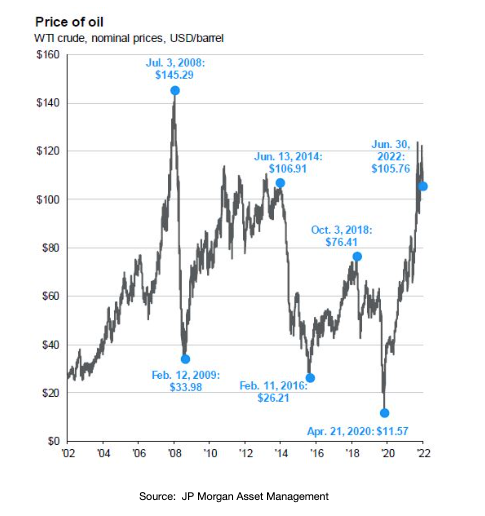
We have also seen oil prices contract in recent weeks, as illustrated in the chart below, due to fears of slowing global growth which may hinder overall demand.
Clearly, it is impossible to say whether or not prices have plateaued or if the Fed’s aggressive rate posture is having the desired effect. June 30th’s PCE report indicating stalling (even falling) inflation could simply be a blip. We do, however, know that the Fed will feel more and more pressure from all sides if market volatility persists and growth slows as they continue to aggressively raise rates.
In fact, I am sure many of you have heard the dreaded ‘R’ word in recent weeks as the media and some high profile CEOs are forecasting a recession as inevitable. While most refer to a recession as two consecutive quarters of negative GDP, the actual definition used by National Bureau of Economic Research (NBER) and their Business Cycle Dating Committee is a bit more nuanced.
Still, the U.S. economy appears to be slowing down, as evidenced by the -1.6% GDP result in Q1 2022. Whether or not GDP growth in Q2 is negative or not remains a very close call, and estimates run the gamut depending on who you ask.
In mid May, the Federal Reserve Bank of Philadelphia conducted its Q2 2022 Survey of Professional Forecasters in which 34 forecasters predicted that real GDP will grow at an annual rate of 2.3% in Q2 (down from 4.2% in their previous Q2 survey). That Philly Fed survey seems a bit frothy to many just a few short weeks later.
In fact, JP Morgan recently cut their Q2 GDP forecast from 2.5% to 1%. In an estimate that is even more bearish, the Federal Reserve Bank of Atlanta’s GDPNow tool predicts that GDP will fall -2.1% in Q2, indicating that the U.S. has likely already fallen into a recession. The chart below illustrates how this prediction has rapidly evolved in recent weeks.
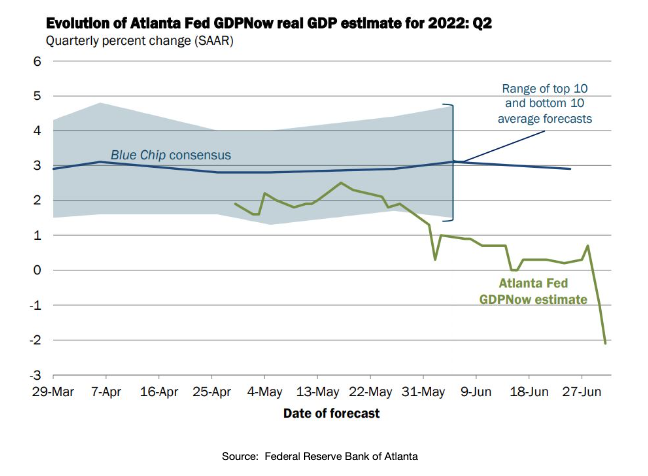
It’s important to note that the GDPNow estimate is NOT an official forecast from the Federal Reserve Bank of Atlanta, but is based solely on mathematical models.
What does this mean for investors?
There are plenty of Chicken Littles out there declaring that the sky is falling. Given how markets have punished investors thus far in 2022, I can completely empathize with that sentiment. As someone who falls asleep and wakes the next day watching market futures, I have certainly grown a few more gray hairs since New Year’s Day. Good news has been sparse in 2022, and investors feel like they have been leaning face-first into headwinds for months at a time.
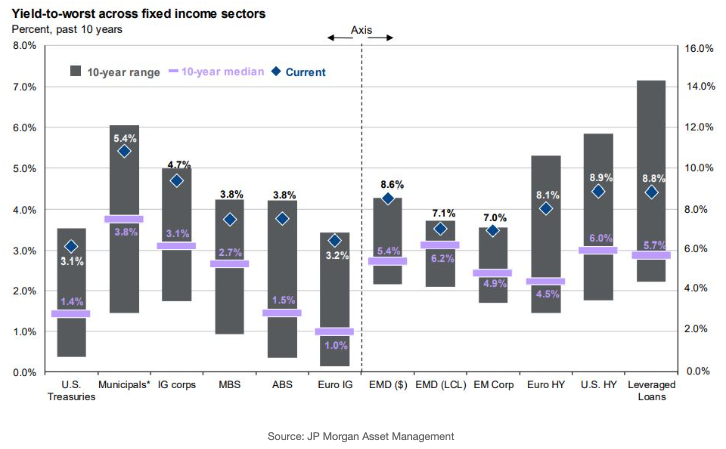
Most professional investors are furious at and frustrated with bonds and the bond market in general, to put it mildly. Yet, it is hard to deny that bonds are quite a bit more attractive, as yields are finally rewarding investors a bit more generously for assuming risk. The chart below illustrates the yield to worst across fixed-income sectors, and you will see that current YTW (blue diamonds) for most sectors is hovering near the top of the 10-year range and, in nearly all cases, significantly higher than the 10-year median yield.
In equities, we have seen the Forward P/E ratio of the S&P 500 fall nearly a full percent below the 25-year average of 16.85%, indicating the valuations are becoming a bit more attractive, as seen in the chart below.
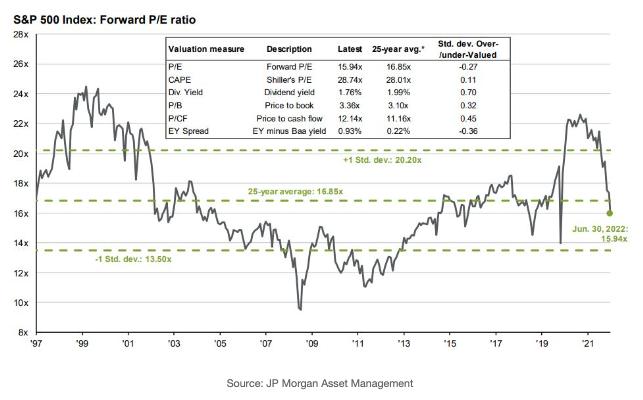
How long will it be before investors again feel that equities are a deal too good to pass up?
I also noticed something curious and interesting in a chart we posted earlier in this letter when we reviewed projections for the fed funds target rate. The chart below illustrates the fed fund rate (gray line), FOMC year-end estimates, and market expectations for the fed funds rate. You will notice that market expectations (green diamonds) aren’t quite in-line with FOMC estimates, as circled in red below.
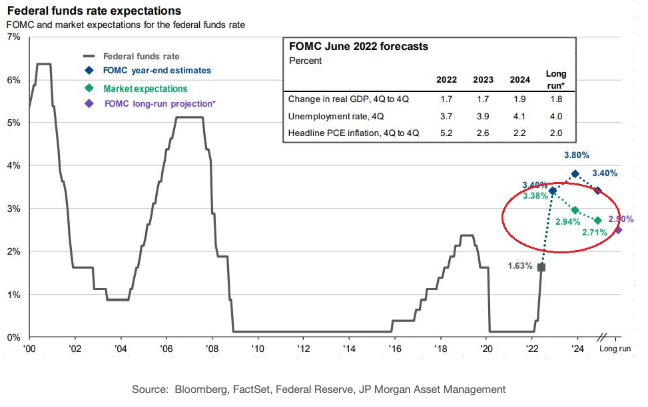
There are many in the investing community who believe that the Federal Reserve will lose its fortitude in the face of enhanced scrutiny over slowing growth, persistent market volatility or even a recession. As such, markets actually expect the Fed to reverse course on interest rates, much like they did in the 2017-2019 cycle as GDP growth exhibited signs of stalling.
Could a change in trajectory happen in the second half of 2022 or beyond? Clearly, these are very nuanced issues and any Fed action is impossible to predict. However, we will close this month’s letter with yet another chart that we referenced previously in this report.
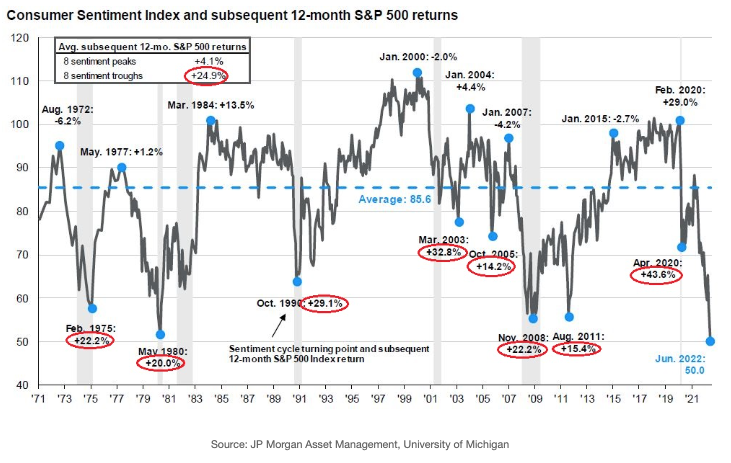
Earlier, we illustrated the stark, historic depths to which consumer sentiment had fallen in June of 2022. The chart below is clearly eye opening on many levels, but can also help to illustrate the resiliency of financial markets (and consumers, for that matter). Since 1971, the University of Michigan Consumer Sentiment Index has experienced eight distinct sentiment peaks and eight distinct troughs. After reaching each of these eight sentiment troughs, the subsequent 12-month return for the S&P 500 has been +24.9%.
While it is important for investors to seek to be appropriately invested for downside protection during periods of elevated volatility, history also tells us that portfolios must be well-positioned for the way back up. While it is obvious that uncertainties remain, and the path ahead may seem fraught, financial markets have been extraordinarily resilient throughout even the most desperate of times.
It’s also important to note that effective financial planning is crucial during volatile portions of the market cycle. We encourage you to lean on the team that is here, ready and eager to serve you. Knowledge of your financial world can be empowering and, quite often, reassuring during volatile times, so please do not hesitate to reach out to your Destiny Capital team to better understand how market volatility may have impacted (or not) your financial outlook.
Important note and disclosure: This article is intended to be informational in nature; it should not be used as the basis for investment decisions. You should seek the advice of an investment professional who understands your particular situation before making any decisions. Investments are subject to risks, including loss of principal. Past returns are not indicative of future results.
Share this
Stay Ahead with Smart Investments
Learn how to invest wisely and minimize risks to protect your retirement savings.

Achieve Your Retirement Goals
Get personalized advice to meet your retirement goals. Book your call with Destiny Capital now.