Markets and Economy Update – April 2023
The statement, “History doesn’t repeat itself, but often rhymes,” is ascribed to Mark Twain. In recent years, I have quoted it quite often. In my November of 2022 Markets and Economy Update, I included the following cartoon from Bob Mankoff of The New Yorker.
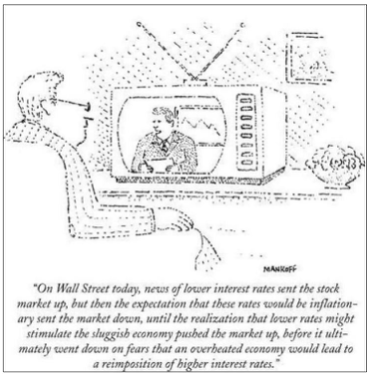
Clearly that cartoon referring to interest rates and the stock market was from late 2022, right? Nope. It was October of 1981, the last time the Fed was in a battle against inflation.
In our March 2023 markets and economy webinar, we polled all attendees to ask what their primary concern was moving forward – inflation, the banking crisis, the debt ceiling debate or financial markets. By far, the topic of greatest concern among respondents was the ongoing debt ceiling debate. For me, this debt ceiling issue has caused immediate flashbacks to the debt ceiling crisis of 2011, which was an experience I was hoping not to repeat in my investing career. Alas, history might not be repeating itself, but it sure does rhyme.
It has been a busy few weeks since my last market and economy update. This month, I will touch on some important issues and events like the debt ceiling debate and the May 3rd Federal Open Market Committee meeting before I close with a brief earnings update.
The debt ceiling
For a few consecutive summers in my late twenties, a group of about fifteen friends and I would caravan the six hour drive from Denver, Colorado to Moab, Utah for a few days of camping, hiking, mountain biking and kayaking followed by whiskey and beers by the campfire each evening. Moab and Arches National Park are breathtakingly beautiful, and the unforgiving, rocky terrain makes for some of the best mountain biking in the world.
At the time, I was a rather novice mountain biker by most standards, but was also both ignorantly brave and (mostly) foolhardy. One year, my endo (aka, an ass-over-teakettle handlebar flip) on the Slick Rock trail resulted in a trip to the closest urgent care and a few X-rays for a potential broken arm.
The next year, I was determined to join my more experienced crew on a prickly trail called Porcupine Rim, which has since been listed as one of the top eight most technical rides in the United States. I did mention I was foolhardy, right? The word “rim” in Porcupine Rim comes from sections of singletrack that ride alongside a steep cliff with precipitous drops down to the Colorado River. Spoiler alert – I survived the Porcupine Rim adventure, but Older Tim still cringes when thinking about Younger Tim traversing those treacherous sections of trail where a slip of a rock or a skid on some gravel could have led to deadly results.
Today, I get the same sense of vertigo and queasiness when thinking about the debt ceiling debate. With a potential default deadline of June 1st, according to Secretary of the Treasury Janet Yellen, lawmakers appear to be drifting ever closer to a treacherous cliff. Just like on my mountain bike ride, when you are that close to the edge, you never know if that rock or gravel may finally crumble beneath your feet.
For those of you who consume any kind of news these days, I am sure you have heard references to the debt ceiling. According to the United States Treasury, the debt limit (ceiling) is the total amount of money that the United States government is authorized to borrow in order to meet its existing legal obligations, including Social Security and Medicare benefits, military salaries, interest on the national debt, tax refunds and other payments. The debt limit does not authorize new spending commitments. It simply allows the government to finance existing legal obligations that Congresses and presidents of both parties have made in the past.
In a case of history rhyming, the United States found itself in a similar predicament in 2011 during the Obama administration, where both Democrats and Republicans found themselves in a contentious battle. The debate, and subsequent downgrade of the United States by Standard & Poors from AAA to AA+, resulted in substantial stock market volatility throughout that year, as seen in the S&P 500 chart below.
As we get closer to the potential date of default (currently estimated to be early June), I would expect to see market volatility begin to ramp up, potentially adding pressure on Congress and the Biden administration to get a deal done. I think that most of us reading this letter may agree that something needs to be done about lowering the United States’ debt. As you can see in the chart below, it has ballooned from roughly $10 trillion to over $31 trillion since the end of 2008.
We also have higher interest rates than in the past, meaning that it will cost more for the United States to borrow while rates remain elevated. Maybe, theoretically, the debt was not as big of a deal when rates were extraordinarily low, but the cost of debt has increased significantly since the end of 2021, as seen in the table below:
| 4/30/23 Rate | 12/31/21 Rate | |
| 3-Month Treasury | 5.10% | 0.20% |
| 5-Year Treasury | 3.5% | 1.3% |
Any recent home buyer needing a mortgage can tell you that there is a big difference in total cost when borrowing at 5% versus 3%. Before too long, the cost of servicing debt could continue to accumulate and could take away from government spending in other areas like infrastructure or even Social Security and Medicare.
I tend to share the viewpoint of Fed Chairman, Jerome Powell, who stated that there is truly no other option than for Congress to raise the debt ceiling in order for the United States to meet its existing financial obligations. This is not necessarily a situation where the Fed can wave a wand and somehow navigate the economy through any potential unforeseen fallout.
The question then becomes, “How perilously close to the fiscal cliff will we come before a deal happens?” For investors, this situation inserts our most hated word into our investing outlook – “uncertainty”. If an agreement is reached, and the debt ceiling is lifted in a prompt manner, markets will likely proceed as if nothing has happened. However, as we get closer to June 1st and no deal is reached, we could see some short-term volatility inserted into the stock and bond markets.
Still, it is important to keep in mind that as bad as the situation got in 2011, the market ultimately rebounded and actually ended up positive on a calendar year basis. So, attempting to time the markets based on an event-driven outcome can be fraught with peril on its own. For now, you can believe that we will be watching this situation closely and hoping for a resolution before any volatility kicks in.
Fed meeting outcome – a pause?
During the Federal Open Market Committee (FOMC) meeting that concluded on May 3rd, investors learned that the Fed had raised the fed funds target rate another 25 basis points (0.25%) to a range of 5.00%-5.25%. This rate hike was in line with what investors, economists and analysts expected, so markets had a bit of a “business as usual” reaction.
However, this FOMC meeting was unique given the Fed’s prepared statement which is read at the onset of each post-meeting press conference. What was unique was not what was included in the statement, but what was omitted. Fed Chairman Jerome Powell even highlighted this in his press conference when he stated, “You will have noticed that, in the statement from March, we had a sentence that said the Committee anticipates that some additional policy firming may be appropriate. That sentence is not in the statement anymore.” He then stressed the importance and magnitude of omitting such a statement from the Fed’s forward guidance.
Since that May 3rd press conference, we have also received a Consumer Price Index (CPI) reading (inflation reading) showing Headline CPI at 4.9% and Core CPI at 5.5%, thus showing additional progress on the Fed’s fight against inflation.
Powell’s comments, coupled with another solid CPI inflation report, tells me that we are looking at a pause when it comes to future interest rate hikes, at least for the next meeting or two in mid June and late July. Generally speaking, this is good news for investors in that it removes a significant element of uncertainty from the investing outlook.
Now that we are looking at the probability of a pause, many impatient investors such as myself then begin asking questions like, “When does the Fed pivot?” A pivot would require the Fed to begin lowering interest rates from current levels. To begin to address this, I will once again look to see if and how history rhymes.
Historically, after a series of rate hikes, the Fed reverses course and lowers rates after a brief pause. This can be seen in the chart below that shows a history of rate hikes (and subsequent rate declines) since the early-to-mid 1990’s. I should note that this trend continues if we stretch the chart back into the 1950’s.
Right now, based on futures contracts with a December of 2023 expiry, investors are pricing a year-end Fed funds target rate of 4.5%. That figure would indicate that investors are expecting rate cuts of over 50 basis points between now and December 31st, which would indicate a Fed pivot at some point over the second half of the year. Will that pivot materialize? History shows that it will, but as we say in this industry, “Past performance is not indicative of future results.” We clearly cannot entirely rely on history as a guide, but it can give us a framework from which to create our forward guidance.
Earnings update
With the Fed seemingly dictating so much of the market action over the past year, it can be easy to lose track of discussing fundamentals including corporate earnings. After all, investors are not acquiring ownership of the economy, but rather, of companies. Thankfully, results from the Q1 earnings season have been quite a bit better than initially anticipated. In fact, Q1 2023 earnings have shown the best relative performance since Q4 of 2021.
With 86% of S&P 500 companies reporting as of May 5th, we have seen 79% of companies reporting earnings above analyst estimates. This 79% figure is well above the 10-year average, with the Energy, Information Technology and Communication Services sectors leading the way, as seen in the chart below from FactSet.
When considering top-line revenues, we have seen 75% of S&P 500 companies reporting revenues in excess of analyst estimates, which is also well above the 10-year average of 63%.
As expected, aggregate earnings growth is currently negative at -2.7%. If this figure holds, it will mark the second consecutive quarter of negative aggregate earnings which would signal what is called an “earnings recession” (where the S&P 500 has two consecutive quarters of negative earnings). This is akin to an economic recession that is loosely defined as two consecutive quarters of negative GDP growth. However, the prospect of an earnings recession is less daunting than it might seem. In 2023, investors consider this more of a normalization process after the stimulus-fueled earnings from the pandemic recovery and not a signal that we should be seeing a market selloff.
In fact, moving forward to Q2 earnings, analysts are projecting an earnings decline of -5.7%, which would mark a third consecutive quarter of negative aggregate earnings. However, to close the year, analysts are projecting earnings growth of +1.2% for Q3 and +8.5% for Q4. So, these quarterly declines in earnings are not expected to persist throughout the remainder of 2023.
Market update
I will now close with a brief market update illustrating year-to-date (YTD) returns across most major indices, as seen in the chart and subsequent table below
- S&P 500: +9.13%
- Dow Jones Industrial Average: +3.38%
- Nasdaq: +16.99%
- Russell 2000 (small-caps): +0.90%
- Bloomberg Aggregate Bond: +2.59%
- United States Treasuries: +2.59%
Generally speaking, it has been a positive start to the year, with growth stocks leading the charge and the Nasdaq up close to +17% and all major indexes in positive territory.
Small-caps and the credit crunch
One index I would like to highlight is the Russell 2000, which is representative of small-caps (market caps of roughly $300 million to $2 billion). We were seeing a bit of a “risk-on” environment to start the year, where we expected to see indexes like the Nasdaq and Russell 2000 outperform the Dow Jones Industrial Average and even the S&P 500. That was the case for the first few months of the year with the Nasdaq and small-caps both up over +12% in early February.
However, small-caps were hit in mid-March as the banking crisis emerged. Small-cap stocks sold off and still have not quite recovered to the level of other asset classes. Why were smaller corporations hit disproportionately hard? Well, generally speaking, smaller companies are a bit more reliant on debt to fund growth and expansion. In 2022, clearly rising interest rates hit small-caps hard, because of the increase in borrowing costs. Then, in March, the banking crisis caused a bit of a credit crunch, and banks and their lenders have been quite a bit more tight with their wallets. This is supported by the following chart that shows the net percentage of banks tightening lending standards for large and middle market firms.
Source: JP Morgan Asset Management – Guide to the Markets
As such, the growth prospects for small-cap companies have been muted a bit in the near-term as the banking crisis wanes. These types of issues are likely common across many small businesses across America, where higher borrowing costs and tighter credit make growth and expansion a bit more difficult, which just so happens to be in line with the Fed’s desire for slower growth and a tighter labor market.
Still, despite the near-term struggles, small and mid-cap companies continue to represent an important part of a diversified portfolio, and they are currently trading at valuations below their 25-year averages. As such, they could represent an opportunity for performance tailwinds as we eventually see investor confidence re-emerge in these asset classes.
By the time the next markets and economy update is released in June, we should have a better understanding of an outcome related to the debt ceiling. Of course, if any important developments occur in the meantime that might affect our investing outlook, we will be sure to communicate with each of you to offer our thoughts and guidance. Until then, please don’t hesitate to reach out to your Destiny Capital team with any questions or concerns about your financial picture.
Important note and disclosure: This article is intended to be informational in nature; it should not be used as the basis for investment decisions. You should seek the advice of an investment professional who understands your particular situation before making any decisions. Investments are subject to risks, including loss of principal. Past returns are not indicative of future results.
Share this
Stay Ahead with Smart Investments
Learn how to invest wisely and minimize risks to protect your retirement savings.

Achieve Your Retirement Goals
Get personalized advice to meet your retirement goals. Book your call with Destiny Capital now.