Coronavirus Update: Peak COVID

It was the summer of 2002, and I was a newly minted Colorado resident who was full of excitement, wonder and – perhaps most of all – naivete. As a new arrival to the state, I was fortunate enough to make a few fast friends, and I eagerly joined them on many adventures that exposed me to activities that I’d never attempted before, from mountain biking in Moab, to whitewater rafting on the Arkansas River, to fly fishing in Kremmling, among many others. This was how I found myself groggily exiting a frigid tent at 5:00 a.m. one Saturday morning, glancing around at my new friends as we each prepared to depart on my first attempt at climbing a fourteener – Mount Princeton – just outside of Buena Vista, CO (for those of you may be unaware, a ‘fourteener’ refers to a mountain whose peak exceeds 14,000 feet).
As I zipped my tent and approached the flickering light of a small campfire, I began to grow a little wary as my friends donned headlamps, hiking boots, backpacks, multi-tools, nalgene bottles, and layer upon layer of apparel with names like The North Face, Columbia, and Patagonia. I thought to myself – what, exactly, am I getting myself into? The group began to slow their activity as they each glanced in my direction, undoubtedly confused at the sight of a guy donned in powder blue jogging pants, muddy old tennis shoes, and a grey hoodie – holding nothing else but a crinkly re-filled 20oz bottle of Arrowhead water. The group shared a quick glance, then sly grins began to spread across each of their faces until they simultaneously burst into raucous laughter upon seeing my utter lack of hiking knowledge or preparation. Naturally, I was mercilessly heckled for my naivete (I prefer that word over ‘cluelessness’), and that heckling continues to this day as stories from that long ago trip are re-told.
Still, what I recall most vividly from that day – aside from the ceaseless verbal skewering – was the never-ending, laboring ascent after our group made it over the treeline at around 12,000 feet. The mountain peak stood enticingly close, yet, after hours of grueling climbing and labored breathing, the peak never seemed to grow closer. It stood in the distance like a cruel mirage, and I eventually realized that I truly had no concept of how long it might take to reach the summit. I simply plodded ahead, concentrating on putting one foot in front of the other time after time after time.
I’m relaying this story because it feels like we are in a similar place with the coronavirus pandemic. Our path has been long and punishing, and – to many of us – it may feel disheartening that we haven’t yet reached ‘Peak COVID’ when considering either total global cases or full economic impact. The summit – for lack of a better term – seems near, but we still have a laborious path ahead, particularly when considering both the loss of life and the release of future economic & earnings data.
As we seem to say in each weekly letter, these are truly unprecedented times, and this week’s update will focus on some of the data that helps to demonstrate how unique this crisis truly is. We’ll begin with our weekly COVID-19 update, then I will share some charts that I’ve found both insightful and alarming now that the depth of this crisis is starting to emerge in newly released data.
COVID-19 Update – as of this writing, there have been 5.7 million confirmed cases of COVID worldwide with 2.3 million recoveries and 356,000 fatalities. In the United States, there are 1.7 million confirmed cases with 356,000 recoveries and just over 100,000 fatalities. Where Destiny Capital is headquartered in Colorado, there are roughly 24,000 cases and just over 1,100 fatalities attributed to COVID-19.
We continue to find it heartening that the growth of confirmed new cases has continued to decline in the United States. This is also the case for many of the most affected countries. However, we are seeing an emergence of COVID-19 in places like Brazil and India, where new case growth appears to be a burgeoning issue.
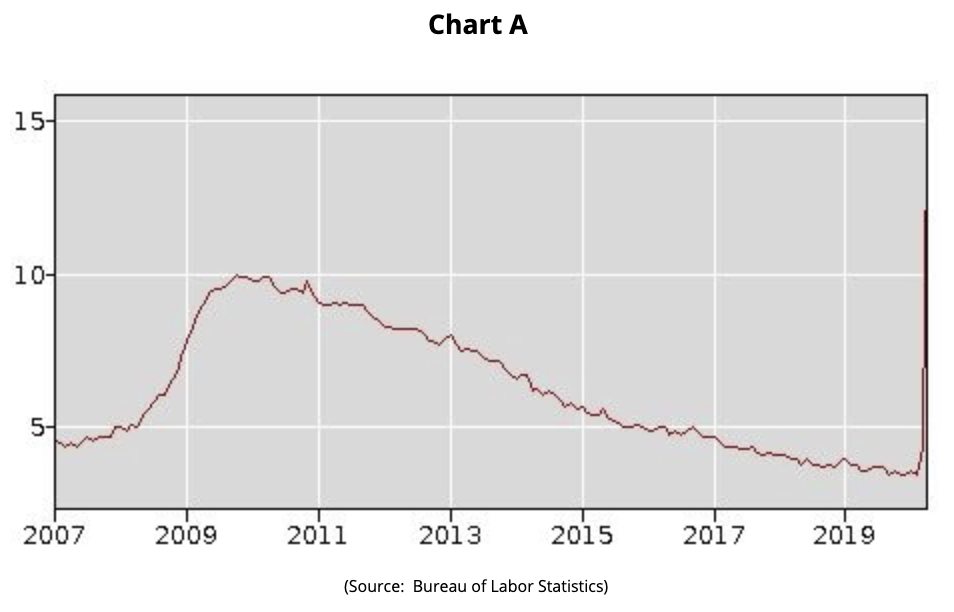
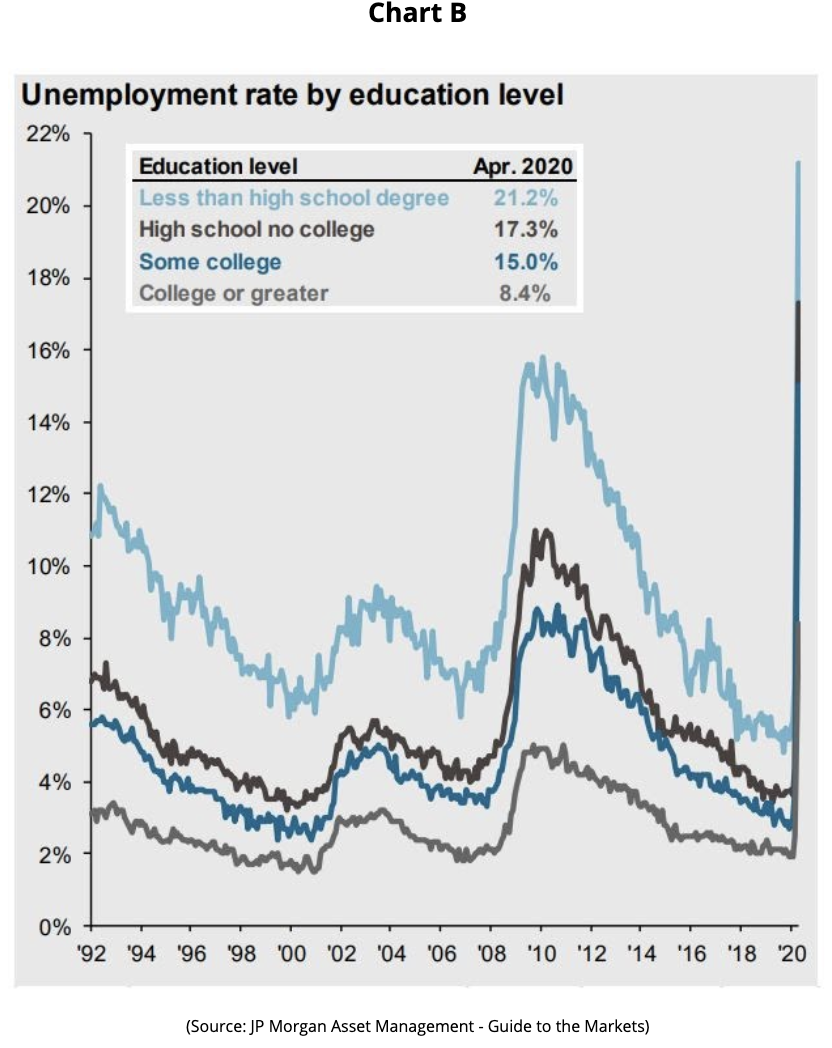
Unemployment – on May 28th, the US Labor Department reported that another 2.123 million people filed for unemployment insurance, bringing the 10-week total to over 40 million. The latest release from the Bureau of Labor Statistics on May 8th showed the unemployment rate at 14.7%, as seen in Chart A below. Consensus estimates expect the unemployment rate to rise to 19.8% when the next BLS report is issued on June 5th. Chart B below breaks down the unemployment rate based on the level of education attained. These numbers nearly jump off the page given how rapidly unemployment has spiked relative to prior recessions.
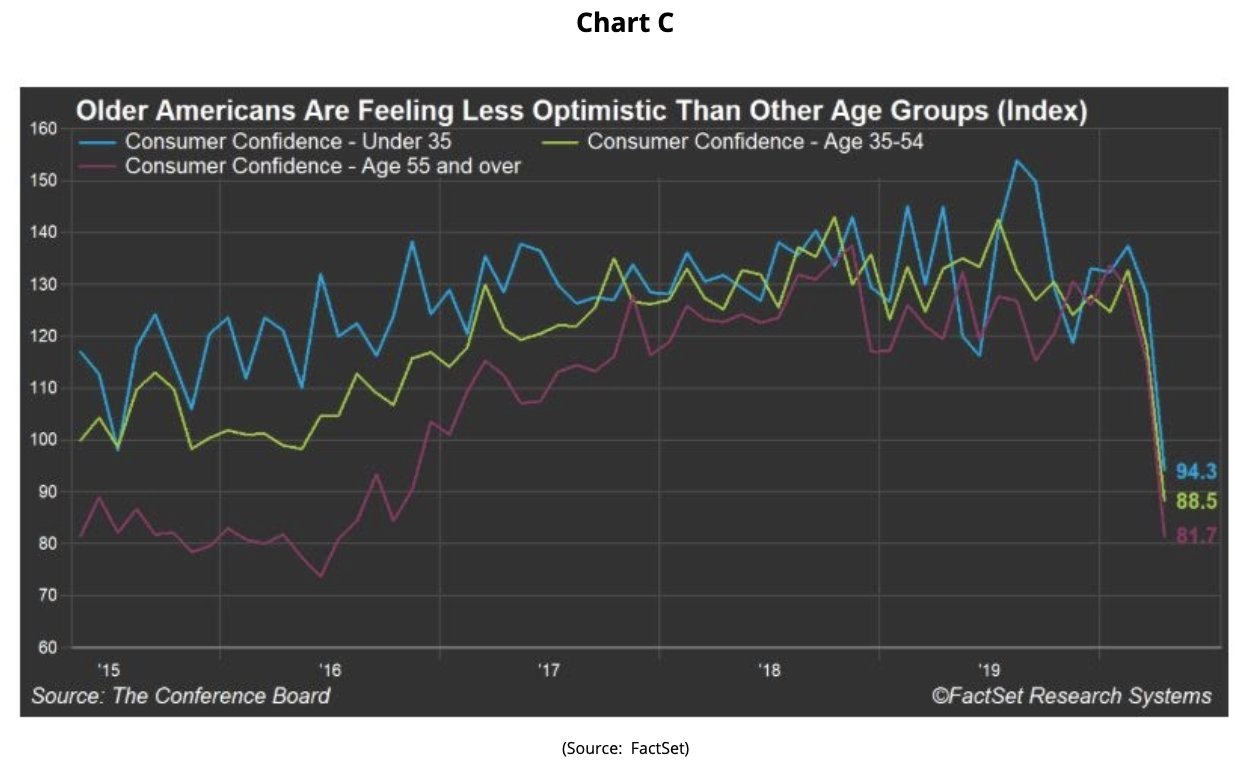
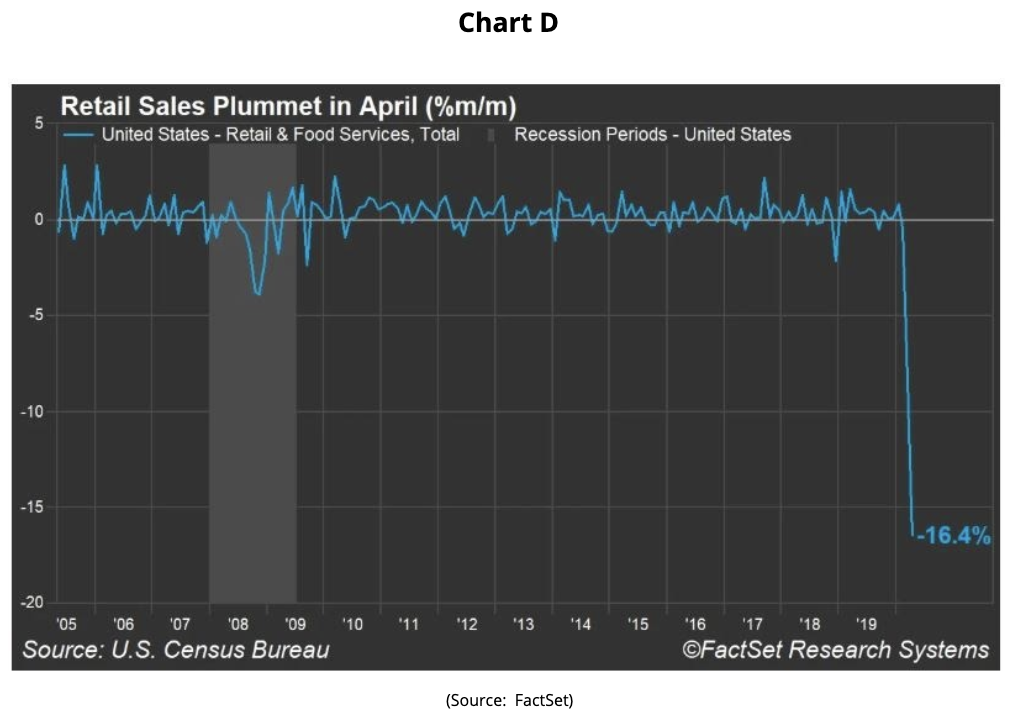
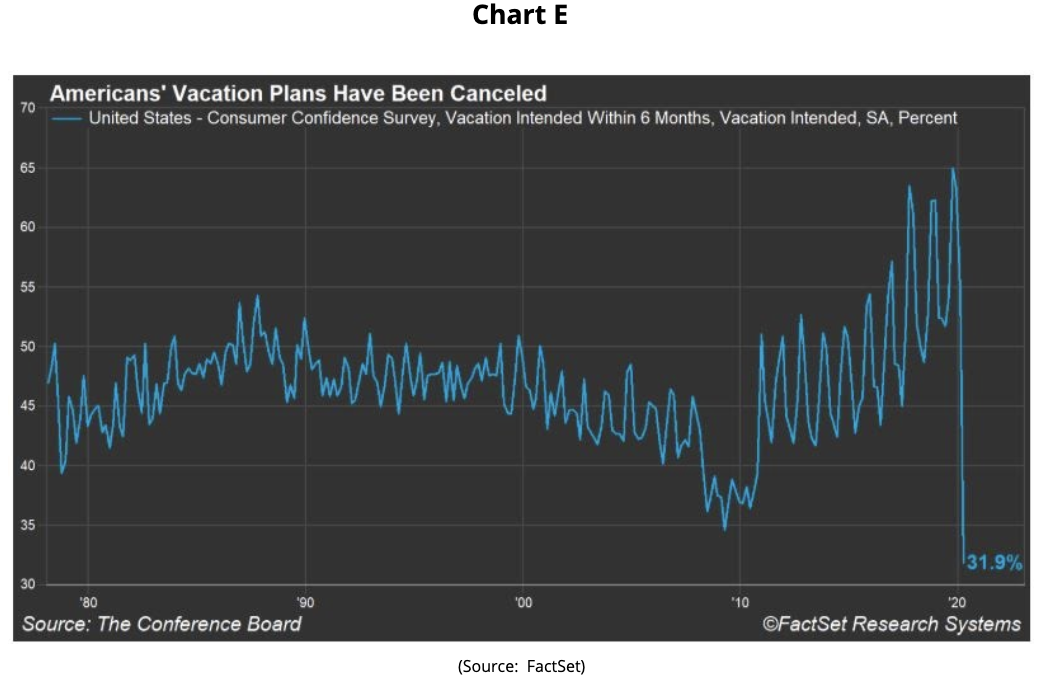
Consumer Behavior – roughly 67% of US GDP is derived from ‘consumption’, so it’s been important for investors to track consumer confidence along with other consumer behavior in recent weeks. Chart C below breaks-down consumer confidence by age group, with individuals 55 and older feeling a bit less optimistic about the economy relative to other age bands. Chart D exhibits a steep decline in retail sales in April and, while we think it is unlikely, we’ll be watching May’s numbers carefully to see if a rebound occurs in retail. Chart E should come as no surprise to many of us who had spring & summer travel plans, as it illustrates a precipitous fall in planned vacations over the next 6 months.
Given much of this change in consumer confidence and behavior, investors might expect sectors like Consumer Discretionary to struggle mightily. However, that’s not been the case in recent weeks, as the Consumer Discretionary sector has been a top performer. This might sound counterintuitive on its face, until you actually look at what companies comprise the Consumer Discretionary sector index. For example, Amazon represents roughly 30% of this sector while The Home Depot represents nearly 8%, and each of these companies have seen their stock price rise between 45%-50% from their lows in Mid-March. This helps to illustrate why, at Destiny Capital, we stress the importance of knowing ‘what’s under the hood’, particularly when investing in passive investment vehicles like exchange traded funds (ETFs). We’ll touch on this topic more at the conclusion of this letter.
Earnings Season Update and Key Global Data – all S&P 500 companies have now reported earnings, and the final numbers show the largest year-over-year earnings decline (-14.6%) since Q3 of 2009 (-15.7%). As reported in prior communications, analysts expect an even steeper decline in Q2 before earnings begin to rebound in Q3 and Q4 of 2020.
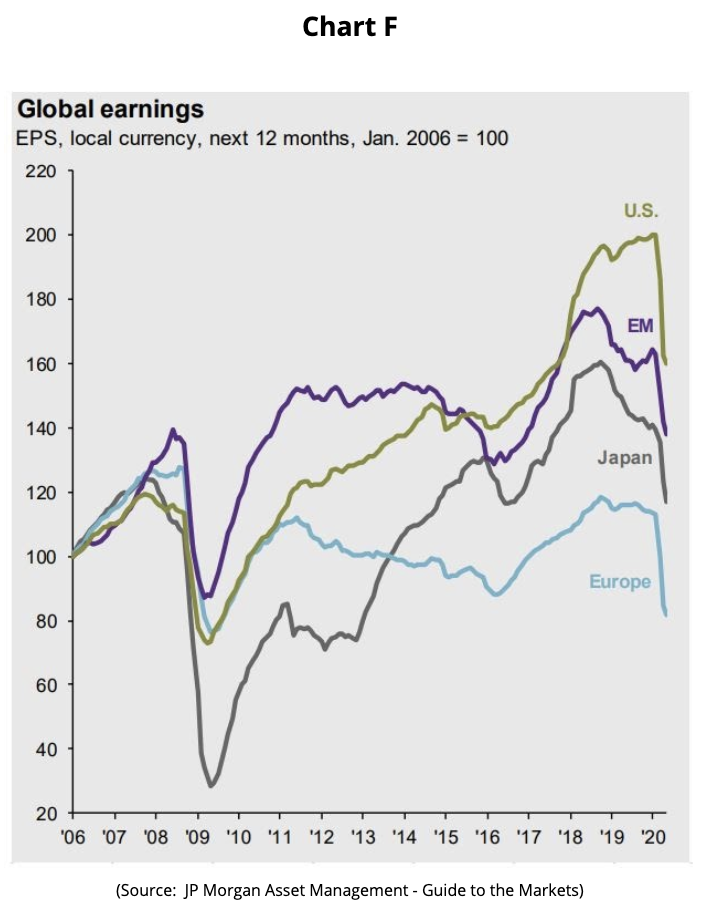
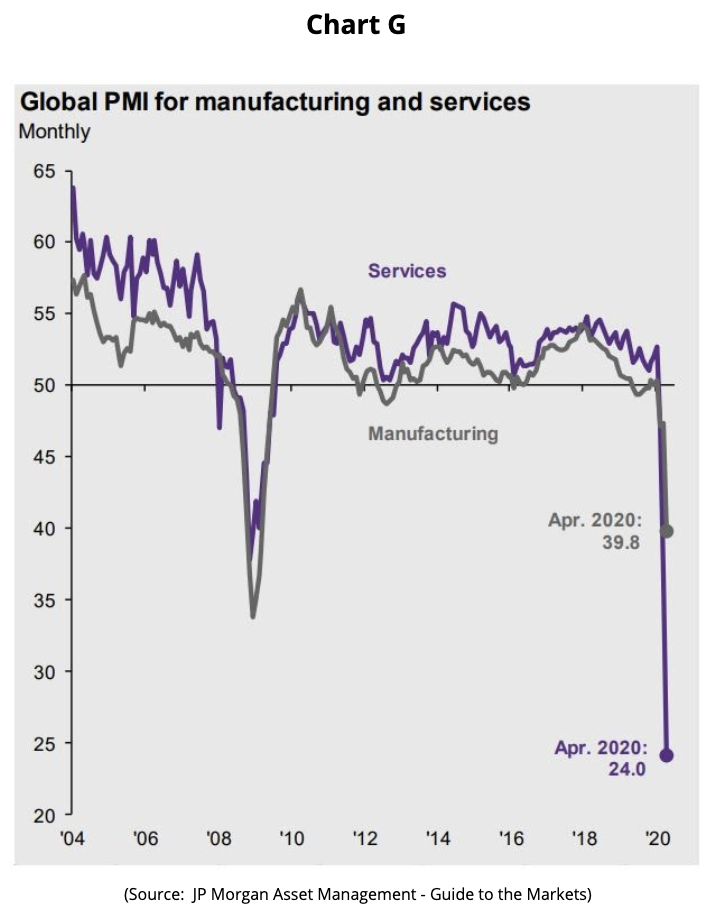
Global data also follows the similar negative trend that we’ve seen in much of the data reviewed in this communication. As expected, no corner of the world was spared by the COVID-19 pandemic, as earnings dropped significantly in the US, Japan, the Eurozone, and throughout Emerging Market economies as seen in Chart F. The Global Purchasing Managers Index is also an important measure of global economic health, as it represents a monthly survey of the business outlook of supply chain managers across 19 different industries. In April, we saw manufacturing and services PMI data fall to historic lows, as illustrated in Chart G below. Typically, we hope for manufacturing and service PMI’s in the 50+ range, and it’s humbling to see how fast and how far PMI data has fallen in a single month.
Let’s be clear, these numbers are even more cringeworthy than an episode of ‘The Office’. I selected these charts because many of them also illustrate what took place during The Great Recession, and offer an interesting, relative perspective to our most recent economic crisis in 2008. I think many of you may find it interesting – and alarming – to see that most of the downward trends resulting from the COVID-19 pandemic exceed anything we experienced during 2008-2009.
Each week, we seem to address the question – “how can markets be so resilient given such negative data?”. When answering these questions, we tend to talk about how – of the 40 million unemployed Americans – many tend to be lower wage workers with less disposable income. We also reviewed that the hardest-hit industries like retail, restaurants & bars, entertainment, airlines & cruises, and hotels & tourism only make up 7% of S&P 500 operating earnings.
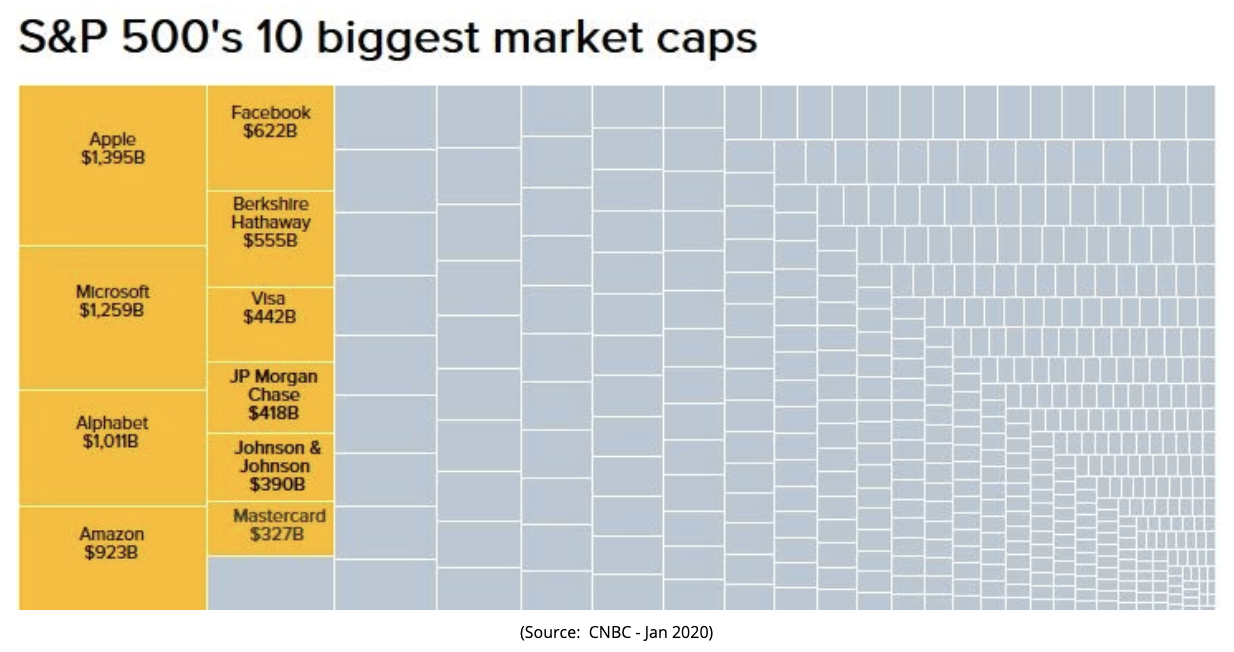
However, it’s also important to understand the primary relative measure that most investors use when referring to ‘the markets’ – the S&P 500. Generally speaking, the S&P 500 is thought of as an index that measures the performance of the 500 largest companies listed on stock exchanges in the United States. Yet, one key item that many investors don’t fully grasp is that the S&P 500 is a ‘cap weighted’ index, meaning that overall performance can be skewed based on the performance of the indexes largest components as measured by market cap (market cap = share price x shares outstanding). In the case of the S&P 500, roughly 25% of the index is represented by its top 10 holdings: Apple, Microsoft, Alphabet, Amazon, Facebook, Berkshire Hathaway, Visa, JP Morgan, Johnson & Johnson, and MasterCard. Of these 10 companies, only 2 have negative year-to-date returns, while companies like Apple, Microsoft, Amazon, and Facebook have year-to-date performance ranging from +9% to +30%.
Therefore, the S&P 500 – while useful – is a somewhat imperfect measure, particularly if you are attempting to draw a correlation between the health of financial markets and the health of the domestic economy as a whole. At Destiny Capital, we take a much more comprehensive approach to our analysis, studying various indices, sector data, and key economic indicators. This helps us to gauge the health of the economy and how it might affect financial markets and investment allocations in both the near term and long term.
As we come to the end of the month of May, we’d like to note that our updates will be distributed on a monthly basis moving forward. Of course, as circumstances change and the COVID-19 crisis evolves, we will be sure to communicate with you to ensure that you are informed, confident, and have a comprehensive understanding of our investment outlook. Between now and our next update, I would encourage you to reach out to your Destiny Capital team with any questions or if we can assist you in any way. As always, please stay safe and stay well.
Share this
Stay Ahead with Smart Investments
Learn how to invest wisely and minimize risks to protect your retirement savings.

Achieve Your Retirement Goals
Get personalized advice to meet your retirement goals. Book your call with Destiny Capital now.