Markets and Economy Update – When Dominoes Start to Fall
by Tim Doyle, Chief Investment Officer, CFP®, MBA
Many new parents quickly learn that, as young children grow older, they often discover unique interests at different stages of development. It could be a particular food, song, toy or TV show that the child becomes particularly attached to for an extended period of time. For instance, when my firstborn son was around two years old, he somehow became obsessed with marching bands, and we’d watch video after video of college marching bands from across the country as he’d look on in wonder. My son was so engrossed with marching bands that, at his insistence, Santa even brought him a tuba for Christmas that year (PS: it was a short-term rental – we’re crazy, but not that crazy). A year or two later, the same little boy developed a keen interest in another unique and completely random item – Rube Goldberg machines.
In case you’re unaware, a Rube Goldberg machine is a contraption designed to complete a simple task like turning on a light switch, yet executes it in a convoluted, drawn-out, humorous/Wile-E Coyote type fashion. In fact, I was reminded of my son’s “Rube Goldberg phase” a few days ago when my iPhone photo app generated a video montage of the time my wife and I took him to see a gigantic Rube Goldberg machine on display near our home. As I watched the video montage of that day, I couldn’t help but draw some parallels between the complex functioning of a Rube Goldberg machine and what’s transpiring across the global economy today.
You see, the global economy is intricately interconnected at a foundational level, even if these connections aren’t always apparent at first glance. So, when one aspect of the economy is impacted or disrupted, it can trigger a chain of events that influences other seemingly disparate elements of the global economy – much like a Rube Goldberg machine in action. Once the first domino tips over, it can be difficult to foresee what components might be impacted down the line.
We’re starting to see this dynamic play-out with the Trump administration’s trade policies, where the introduction of steep tariffs have impacted other key economic components like interest rates, the U.S. dollar, inflation, GDP, the stock & bond markets, and more. We’re starting to see some economic dominoes begin to fall and, in this month’s investor letter, we’ll attempt to unravel how U.S. trade policy is influencing the global economy and what it might mean for investors, and we’ll start with a brief market update.
Market Update – Is Volatility Here to Stay?
As I’ve written many times, 2024 was an abnormal year for the stock market. It was abnormal given how muted volatility remained throughout most of the calendar year, particularly considering the fact that the United States held a contentious Presidential Election in November. Conversely, activity in the stock market in 2025 has been jarring by comparison with most major stock market indexes swinging wildly from one day to the next. This volatility has largely been driven by the uncertainty surrounding the rapid fire changes in U.S. trade policy in recent weeks. The chart below helps to illustrate this volatility by showing the day-to-day market returns during the first 100 days of the Trump presidency. As you can see, markets have often been “one step forward, one (or two) steps back” during the months March and April.
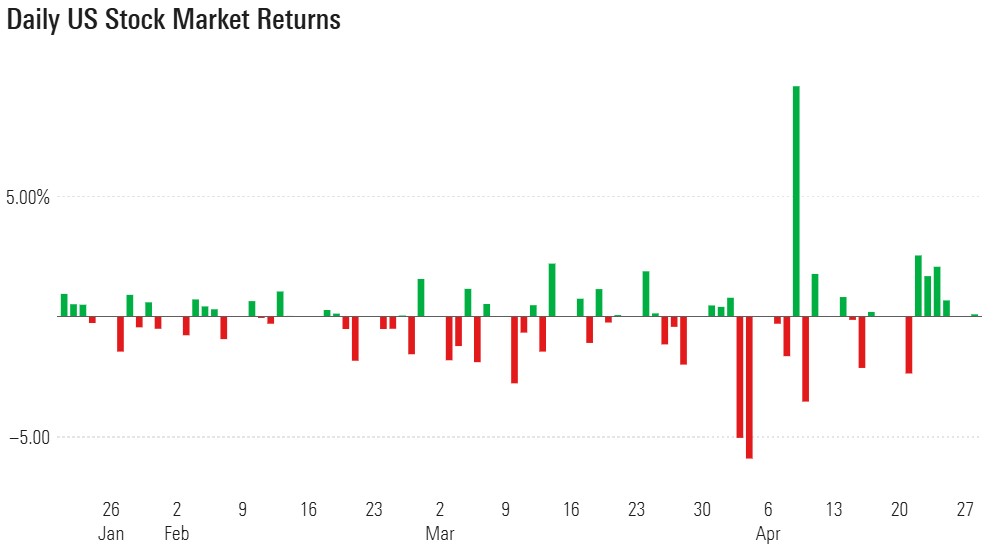
Source: Morningstar
At Destiny Capital, we also gauge stock market volatility by monitoring the CBOE S&P 500 Volatility Index (the ‘VIX’). We consider any reading at or above 20 to indicate elevated volatility, and the higher the VIX goes, the greater the daily volatility is expected to be. Whenever the VIX reaches 25 or above, I tend to keep the antacid tablets close at hand and, between March 1st and April 30th, the VIX had an average reading of nearly 27. Investing has not been for the faint of heart as-of late.
When it comes to investment performance in 2025, investors are seeing a mixed bag across a variety of asset classes. As you might expect, riskier stocks have declined the most on a year-to-date basis with the tech-heavy Nasdaq Composite Index and the Russell 2000 (Small Cap) index declining -9.5% and -11.6%, respectively. As of this writing, the S&P 500 index is down roughly -4.9% and the Dow Jones Industrial Average down -3.9%, as you can see in the chart below.
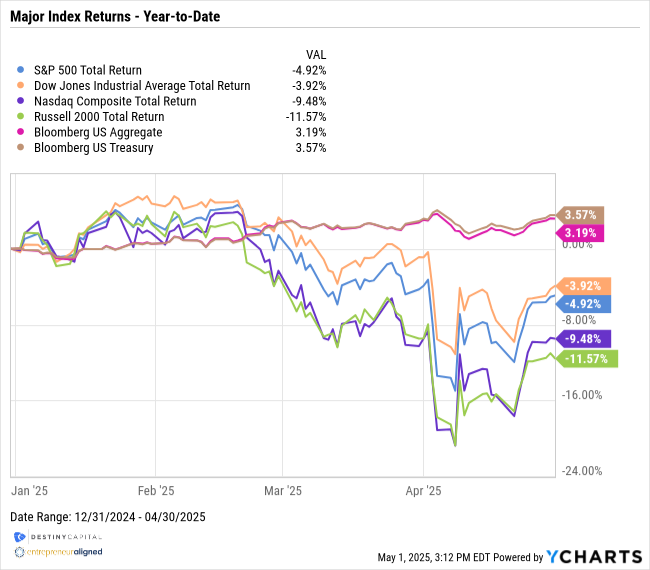
Keep in mind, these are year-to-date numbers and don’t necessarily represent the peak-to-trough decline in these assets. For example, the S&P 500 hit its last high on February 19th and, by early April, had fallen nearly -18% from top to bottom. Meanwhile, bonds continue to provide portfolio ballast with a +3.5% return for U.S. Treasuries and a +3.1% return for the Bloomberg US Aggregate Bond index.
Regardless, moving forward, we expect volatility to remain elevated until investors have a more concrete understanding of what the long-term trade policies might look like for the United States and its global trade partners. This leads us to the ‘Rube Goldberg effect’ of tariffs and how they’ve impacted other elements of the economy since the initial tariffs on Mexico and Canada were announced in early March.
Gross Domestic Product (GDP) – Declining Growth
On April 30th, the Bureau of Economic Analysis (BEA) released the Gross Domestic Product (GDP) report for the first quarter of 2025 and – for the first time in roughly three years – GDP came in negative at -0.3%. This is important because a recession is loosely defined as two consecutive quarters of negative GDP growth.
However, the Q1 GDP figure was not a surprise to most investors. The calculation for GDP is GDP = Consumer Spending + Business Investment + Government Spending + (Exports – Imports). Therefore, the GDP calculation for Q1 was somewhat skewed because we saw Q1 imports surge significantly in anticipation of the Trump administration’s tariffs. Essentially, companies were seeking to build-up inventories before everything got more expensive. Therefore, net exports (aka exports – imports) served as an anchor for overall GDP growth in Q1. That doesn’t mean that this GDP reading isn’t concerning.
Q4 2024 GDP was a solid 2.4% and, regardless of the impact of net exports, economists are concerned about a general slowdown in the U.S. as trade uncertainty persists. All eyes will be on the Q2 2025 GDP report to see if we get two consecutive quarters of negative growth. To track GDP forecasts, we typically follow the Atlanta Fed’s GDPNow tool as it tends to be the most data-driven and accurate.
The Declining Dollar
If there’s one thing I’ve learned in my career as an investor, it’s that it can be close to impossible to anticipate movements in any currency, including the U.S. dollar. Still, it’s hard to deny that the dollar has weakened a bit in 2025, as you can see in the chart below.
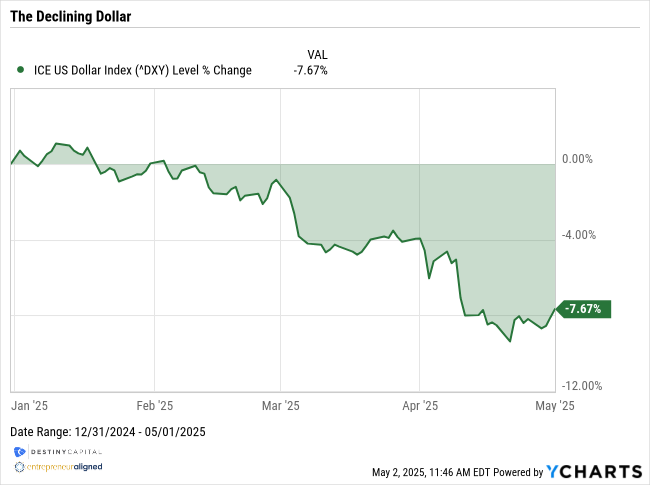
Since the great financial crisis of 2008, the U.S. dollar strengthened tremendously relative to other currencies. Global investors, including foreign central banks, have been drawn to U.S. assets for two primary reasons – stability and growth. The U.S. is largely viewed as the strongest economy on earth with the most stable system of government. This helps to justify global faith in the U.S. dollar and why short-term U.S. Treasuries are often referred to as ‘risk free’, because they are backed by the full faith and credit of the U.S. government.
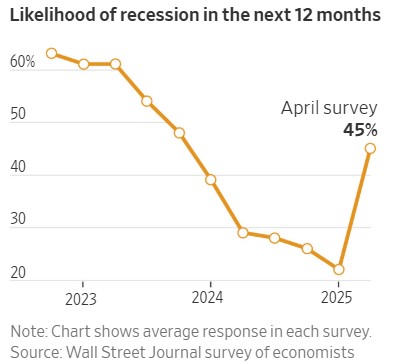
So, what has caused the short-term weakening in the dollar? Well, the reasons for this could be many. The recently announced tariffs may cause global investors – including foreign central banks – to question their assumptions about the near-term strength of the U.S. economy and the stability of its government. According to many economists, the newly announced tariffs have increased the risk of recession in the United States, and this can be seen in the chart below that shows a recent survey conducted by the Wall Street Journal.
Elevated recession risk has led to a bit of a rotation out of U.S. assets – like S&P 500 stocks – and into international and emerging market equities, which have surged in recent weeks.
There has also been a trend of foreign central banks reducing reliance-on and demand-for U.S. Treasuries. This is part of the reason why gold prices have surged in recent years, because central banks in China, India and others are diversifying their holdings – particularly into gold – which has reduced demand for the U.S. Treasuries and, subsequently, the U.S. dollar.
Does this mean that the dollar will lose its status as the world’s primary reserve currency? Not so fast. A slight weakening in the dollar could actually be viewed as a positive as it could make U.S. exports more affordable in foreign markets. However, investors and economists will likely be keeping a keen eye on the dollar to gauge whether or not the 2025 decline is a short-term blip, or a longer-term trend.
Interest Rates
It is my contention that recent changes in interest rates may have been what caused the sudden reversal in U.S. trade policy on April 9th when the 90-day tariff ‘pause’ was announced for all trade partners except China. Before we delve into that topic a bit further, I want to clarify a few points around interest rates.
When it comes to interest rates, economists and investors tend to focus on two key rates – the federal funds rate and the 10-Year U.S. Treasury rate. The fed funds rate is set by the Federal Reserve, and it represents the overnight interest rate used for short-term lending between banks. The fed funds rate is also closely tied to short-term (1-3 month) U.S. Treasury bills. As such, the fed funds rate helps to set the short end of the US Treasury yield curve.
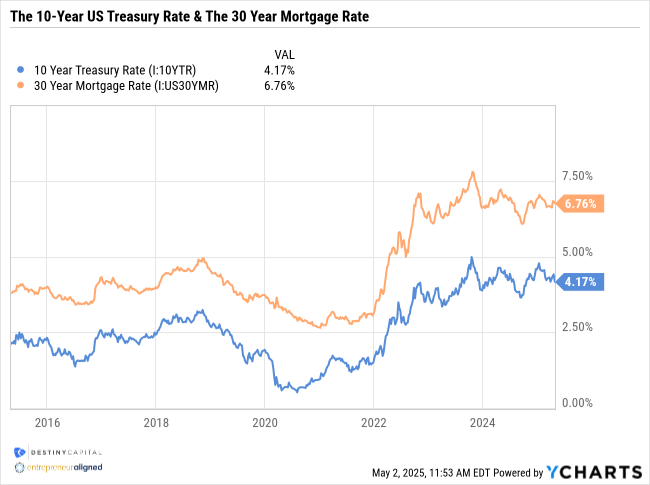
The 10-Year US Treasury rate is also very important because it is often considered the baseline rate for many medium-to-long term debt instruments including the 30-year mortgage rate, corporate bonds, student loans, auto loans, business lending, agency debt and more. As an example, the chart below helps to illustrate the relationship between the 10-Year US Treasury rate and the 30-Year mortgage rate. As you can see, over time, long-term mortgage rates tend to consistently hover 2%-2.5% above the 10-year Treasury rate.
While short-term rates are heavily influenced by Fed monetary policy, longer-term rates like the 10-year Treasury are largely driven by market dynamics, changing economic conditions, and so forth. For example, we might see the 10-year Treasury rate rise or fall for reasons including (but not exclusive to):
Inflation: if inflation is rising, investors will demand higher yields to overcome higher aggregate prices and the loss of purchasing power.
Federal Deficits: as deficits rise, more Treasury debt must be issued. Investors may demand higher yields in order to attract buyers for such substantial amounts of debt.
Global Demand for US Treasuries: if investor confidence is shaken in the stability of the U.S. government or the creditworthiness of the United States as a borrower, demand could fall which could cause rates to move higher in order to attract investors.
Economic Growth Expectations: fluctuations in GDP growth over time could cause the 10-year US Treasury to move higher and lower. Higher rates are often associated with strong GDP, while declining rates are typically associated with slower or declining growth.
Why does any of this matter? Well, when the substantial new tariffs were announced by the Trump administration in early April, investors across the globe grew alarmed as the 10-year US Treasury rate rose suddenly and sharply from around 4.00% on April 4th to 4.50% by April 11th. This unsettling ascent can be seen in the chart below.
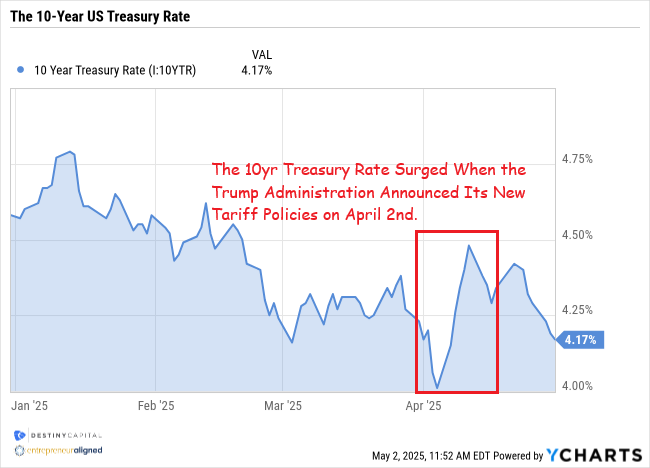
Given the fact that interest rates and bond prices have an inverse relationship, this sudden spike in interest rates caused a sharp decline in bond prices, thus causing the Bloomberg US Aggregate Bond Index to decline nearly -2.5% in just a few trading days. While volatility in the stock market is largely understood and accepted, a sudden 0.50% surge in the 10-Year US Treasury rang alarm bells for economists and investors alike. Left unabated, many wondered how high interest rates might climb in the near term.
Given his real estate background, interest rates are part of President Trump’s vernacular and he understands how high interest rates can restrict economic growth and, among other things, exacerbate issues like housing affordability in the U.S. Therefore, on April 9th – just as the 10-year Treasury rate approached 4.5% – the Trump administration announced a 90-day pause on tariffs (excluding China), and concerns about interest rates have since abated for the time being.
This rate activity also reiterated the point that important baseline rates like the 10-year Treasury are largely driven by market dynamics, and not Fed policy. The Fed could drop the fed funds rate to 0.25%, but that doesn’t necessarily guarantee that the 10-year Treasury Rate will automatically follow suit. Therefore, we’ve seen the Trump administration begin to ease the public pressure on Fed Chairman, Jerome Powell, to lower interest rates – at least for now.
Are Higher Prices on the Horizon?
At the end of April, the Bureau of Economic Analysis (BEA) released their Personal Consumption Expenditures (PCE) inflation report. While PCE came in slightly higher than consensus estimates (2.3% actual vs. 2.2% estimated), the market reaction remained somewhat muted as investors have taken a ‘wait and see’ approach towards inflation.
As I’ve written many times, we anticipate that widespread tariffs will likely increase aggregate prices, thus pushing both the Consumer Price Index (CPI) and PCE higher on a year-over-year basis in the coming months. This is because tariffs are paid for by U.S. importers like Target, WalMart, Home Depot, IKEA, Lowes and many more. The added cost of tariffs can be either absorbed by the company, thus decreasing profits, or the added cost can be passed on to consumers in the form of higher prices (or a bit of both).
Given how rapidly the size, scale and scope of the new tariffs have changed over time, it is difficult to predict just how much higher aggregate prices may go. Regardless, one thing is clear, consumers have received the message and they are expecting prices to move higher – substantially higher in the next twelve months. This can be seen in the chart below that illustrates changes in the one-year consumer inflation expectations as recorded in the Consumer Sentiment Survey conducted by the University of Michigan each month.
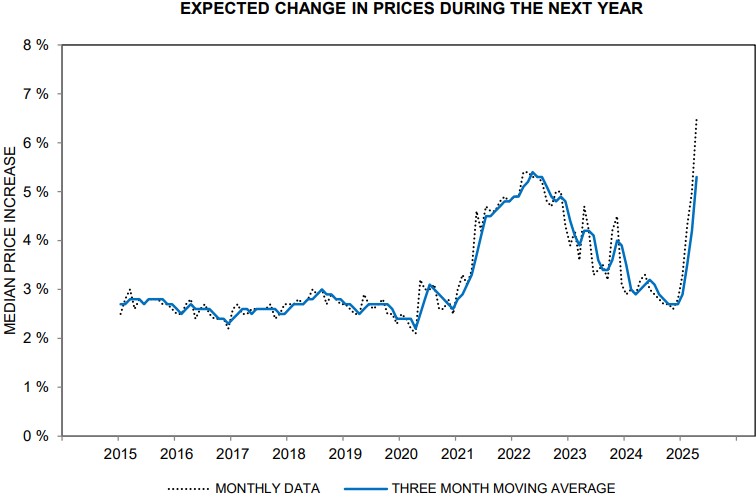
Source: University of Michigan Consumer Sentiment Survey
As you can see, consumers expect aggregate prices to rise +5% or more in the coming year – levels not seen since inflation last surged to over 9% in 2022. If 2022 taught us anything, it’s how frustrating and damaging inflation can be for consumers as their purchasing power rapidly erodes. This pessimistic mindset, in turn, is reflected in overall consumer sentiment, which has fallen off a cliff in recent months and approaches levels last seen during the Summer of 2022.
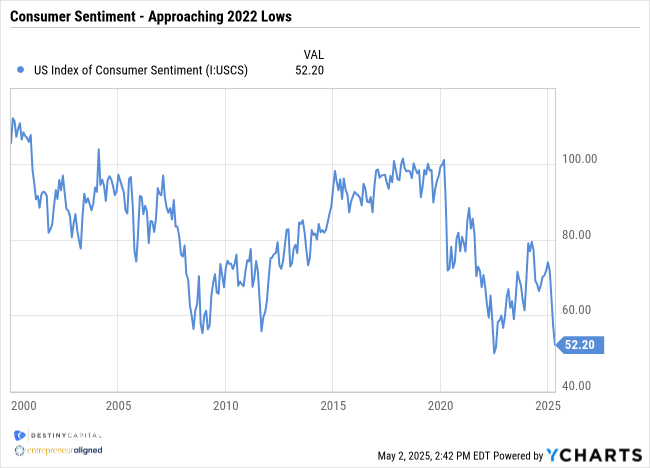
As I’ve written many times, “as goes the U.S. consumer, so goes the U.S. economy” due to the fact that roughly two-thirds of U.S. GDP is derived from consumption. However, just because consumers are pessimistic doesn’t necessarily mean that they are changing their buying behavior. For now, the labor market remains somewhat strong and, as long as consumers have jobs, they tend to spend. However, we’ll be closely monitoring other indicators like retail sales to help gauge whether or not consumers are tightening their belts.
Summary
Last summer, my family visited some relatives in the Washington D.C. area, and my son spent some quality time with his older second cousin. For hours, the two of them would giggle and guffaw as they played with a Magic 8 Ball and asked it question after silly question. I can’t help but think of that Magic 8 Ball when I contemplate what’s in store for the U.S. economy between now and year-end, as I’d imagine that the persistent answer I might receive would be “Outlook Hazy. Try Again” or “Ask Again Later”. This is because nobody truly knows exactly what U.S. trade policy is going to look like one week from now, let alone in six, twelve, or twenty-four months. This situation remains extraordinarily fluid, and markets have been extremely reactionary to any news that emerges, even if the news turns out to be unsubstantiated.
As this letter has intimated, investors remain on high alert because there is virtually no aspect of the U.S. (or global) economy that will not be impacted by substantial changes to U.S. trade policy. For now, like a commercial aircraft circling an airport waiting for conditions to improve in order to land, corporations and investors alike remain in a bit of a ‘holding pattern’. While a holding pattern may be okay for a brief time, if uncertainty persists, this wait-and-see approach could hinder future economic growth in the quarters ahead.
For now, the U.S. economy and financial markets remain incredibly resilient. We are deep into earnings season, with 72% of S&P 500 companies reporting Q1 2025 earnings thus far. By and large, results have been positive with 76% of companies beating earnings-per-share (EPS) estimates, which is above the 10-year average. As of this writing, the blended earnings growth rate for the S&P 500 is +12.8% and, if this figure holds, will represent the second consecutive quarter of double-digit earnings growth. For the time being, the stock market appears to be holding up its end of the bargain for investors.
As always, moving forward, we will keep you up-to-date with any meaningful changes that might impact the outlook for investors. If you have any questions about your portfolio, please reach out to your Strategist or Coordinator. If you have any questions about markets or the economy, in general, I would encourage you to submit questions to my CIO Mailbag where I directly address investor questions.
Important note and disclosure: This article is intended to be informational in nature; it should not be used as the basis for investment decisions. You should seek the advice of an investment professional who understands your particular situation before making any decisions. Investments are subject to risks, including loss of principal. Past returns are not indicative of future results. Advisory services offered through Destiny Capital Corporation, an Investment Adviser registered with the U.S. Securities & Exchange Commission.
2024 YCharts, Inc. All Rights Reserved. YCharts, Inc. (“YCharts’) is not registered with the U.S. Securities and Exchange Commission (or with the securities regulatory authority or body of any state or any other jurisdiction) as an investment adviser, broker-dealer or in any other capacity, and does not purport to provide investment advice or make investment recommendations. This report has been generated using data manually input by the creator of this report combined with data and calculations from YCharts.com and is intended solely to assist you or your investment or other adviser(s) in conducting investment research. You should not construe this report as an offer to buy or sell, as a solicitation of an offer to buy or see, or as a recommendation to buy, sell, hold or trade, any security or other financial instrument. THE IMPORTANT DISCLOSURES FOUND AT THE END OF THIS REPORT (WHICH INCLUDE DEFINITIONS OF CERTAIN TERMS USED IN THIS REPORT) ARE AN INTEGRAL PART OF THIS REPORT AND MUST BE READ IN CONJUNCTION WITH YOUR REVIEW OF THIS REPORT. Disclosure – YCharts
Share this
Stay Ahead with Smart Investments
Learn how to invest wisely and minimize risks to protect your retirement savings.

Achieve Your Retirement Goals
Get personalized advice to meet your retirement goals. Book your call with Destiny Capital now.