
Markets and Economy Update – The Election, Debt & Social Security
I’m not sure if anyone else finds themselves in this situation, but I find my social media feeds saturated with clips from the Dave Ramsey call-in show. If you aren’t familiar with this content, these clips/shows are like watching a car wreck – you simply can’t look away. Callers with dire financial circumstances dial the show seeking financial advice, stating things like, “Well, I have $76,000 in credit card debt, $430,000 in student loans from my 2nd PhD in botany, I just bought a Ford F-150 Raptor and have an $80k loan on that. Oh, and I make $12 per hour as a yoga apprentice. What should I do to get out of debt?” Hilarity ensues.
Sadly, I couldn’t help but think of this call-in show as I compiled data for this month’s blog that delves into topics related to federal spending and the U.S. national debt. It’s not necessarily a pretty picture from the perspective of a financial planner.
Furthermore, during internal team meetings throughout the year, I often ask our client service teams (Strategists, Coordinators, etc.) about what they are hearing from clients. What are their concerns? What questions arise most often during meetings? How can we help clients feel informed, engaged and empowered as investors?
Over the past few weeks, the answers to my questions have been centered around one topic – the November election. The election is top of mind for most investors, and they want our viewpoint on how the outcome in November might impact investing strategy. Therefore, given that we are roughly five months out from the election, I thought this would be a good time to revisit the election and what, we believe, investors should be watching closely. To be very clear, this is a very sensitive and contentious topic for many, and our intent is to simply offer input from our perspective as investment managers. We do not approach this from the perspective of good vs. bad or right vs. wrong.
Politics and Behavioral Finance
Throughout my time in the business of investment management and financial planning, I’ve gained fascinating insight into the world of behavioral finance. Behavioral finance delves into the realm of human behavior by studying themes, traits and biases that may impact how an individual interacts with money. For example, many people, including myself, deal with the behavioral concept of ‘loss aversion’ where portfolio losses create more pain than any pleasure that may be generated through an equivalent gain. In short, a -10% loss hurts way more than any pleasure generated from a +10% (or more) gain.
In recent years, another potential bias seems to have emerged around politics and government, and the chart below helps to illustrate it. The Pew Research Center conducts an ongoing study where they poll citizens and ask them their political affiliation (Republican, Democrat or Independent) and how they would rate national economic conditions. The chart below illustrates the percentage of Republicans (red) and Democrats (blue) who rate the current economic conditions as ‘good’ or ‘excellent’. The vertical dotted lines represent a presidential election that resulted in a new administration.
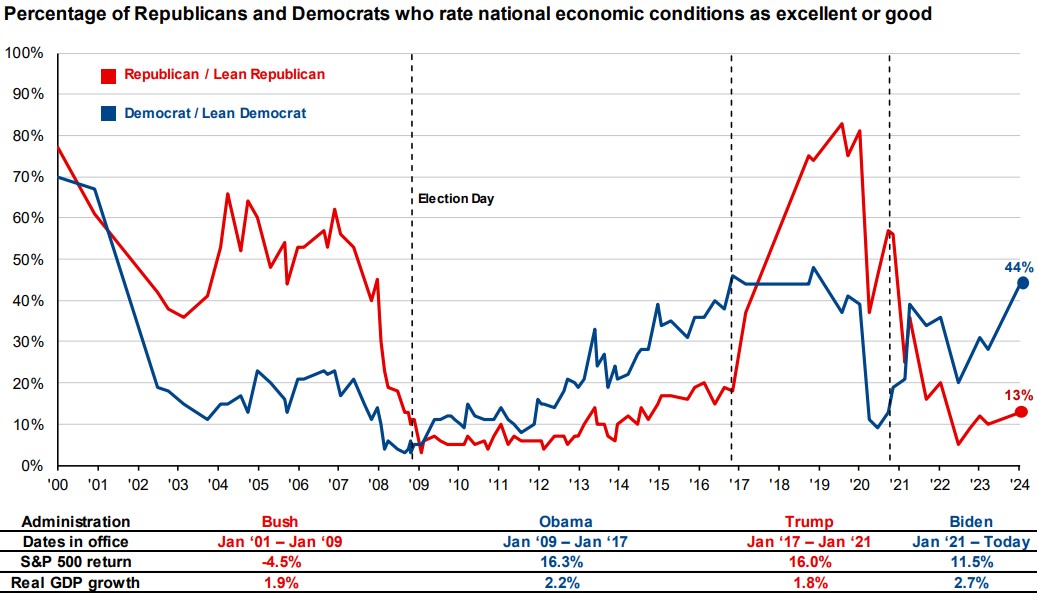
Source: JP Morgan – Guide to the Markets
As you can see, Republicans are more positive about the economy with a Republican in the White House. Conversely, Democrats are more positive about the economy with a Democrat in the White House. This chart is perhaps stating the obvious, but it becomes important to consider when these changes in sentiment impact investment decisions over time.
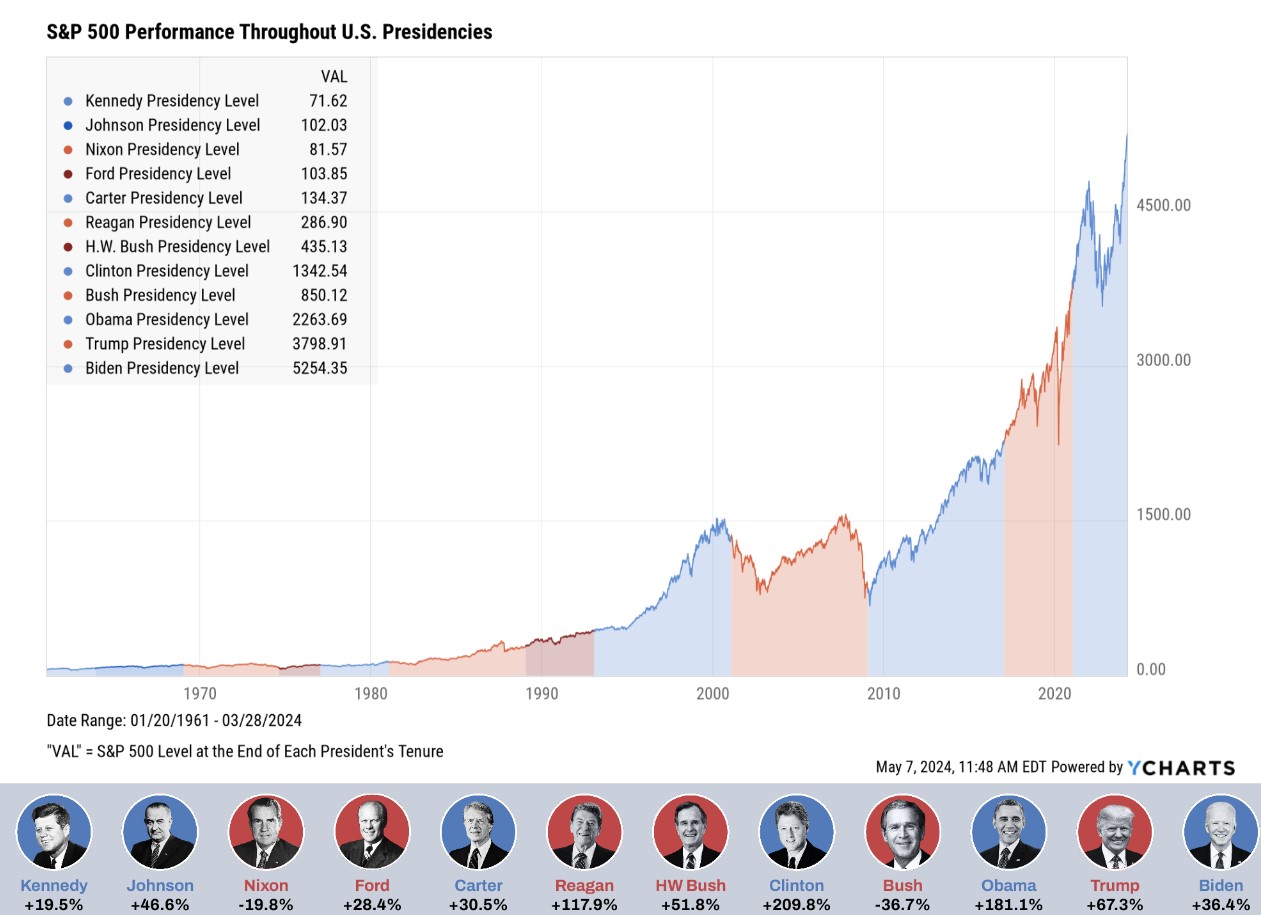
The truth is that financial markets are fairly ambivalent to politics, and the chart below helps to illustrate this. For example, if an investor was skeptical about a particular administration and decided to ‘sit on the sidelines’ during a particular presidency solely due to political affiliation, they likely would’ve missed-out on elements of the market’s ascent. As we see below, the S&P 500 has risen from 71 during the Kennedy presidency to over 5,200 during the Biden presidency.
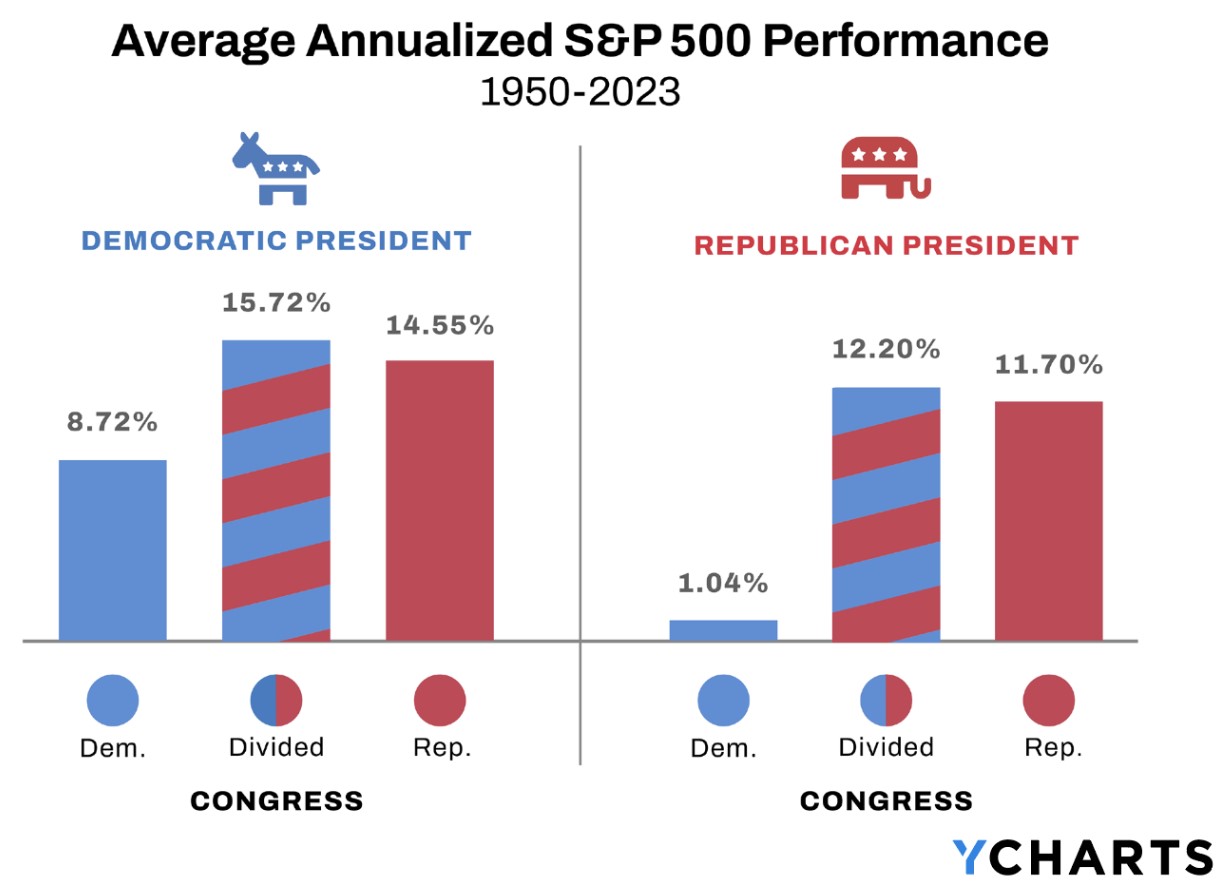
The graph below also shows the averaged annualized performance of the S&P 500 index based on which party controls the White House. The graph then provides a breakdown of who controls the House & Senate during Democratic and Republican administrations. More often than not (roughly 60% of the time) there is ‘divided government’ where one party holds the presidency while the other party controls the House and/or Senate. During periods of divided government, the S&P 500 has averaged returns of roughly 15% and 12%. I think most investors would be perfectly happy with that type of outcome.
Investors sometimes ask “if XYZ wins, will you be making a portfolio change?” Making investment decisions solely based on an election outcome tends to contradict two of our core principles of investing. One of these principles is that we are data-driven. We make decisions based on objective data, not ‘gut feelings’. Decisions based on emotion tend to lead to negative outcomes.
We are also disciplined. This means we do not chase returns or seek to time the market. Making investment changes on-or-around election day has a ‘market timing’ element that would make me a bit uneasy. Selling can be easy. The hard part is knowing or judging when to buy back in.
Of course, if a particular party plans to raise the capital gains tax rate to 50% or seeks to implement a 45% flat tax on corporations, then that could have a material impact on investors should that party win. Barring that unlikely outcome, we’ll continue to track economic data and make portfolio decisions that we deem are in the best interests of our investors.
An Area of Focus – Spending & Debt
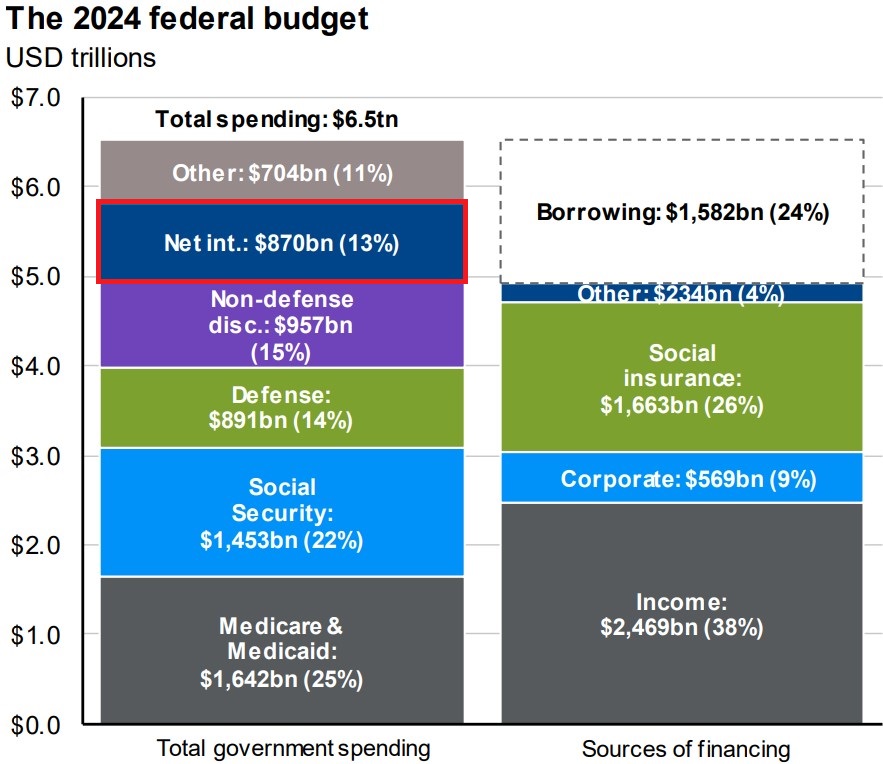
Simply put, the United States appears to be on an unsustainable path as it relates to the national debt. Each year, the federal government spends more money than it generates in revenues. According to the Congressional Budget Office (CBO), the federal government is expected to spend $6.5 trillion on budget items like Defense, Social Security, Medicare & Medicaid, and more. The federal government only generates about $4.9 trillion in revenues from taxes. The graph below helps to illustrate this.
Source: JP Morgan – Guide to the Markets
This leaves a 24% budget shortfall of roughly $1.58 trillion that must be filled through borrowing. The federal government borrows money by issuing U.S. Treasury bonds. These bonds function just like any other bond and must be paid back, with interest, to bond purchasers/investors.
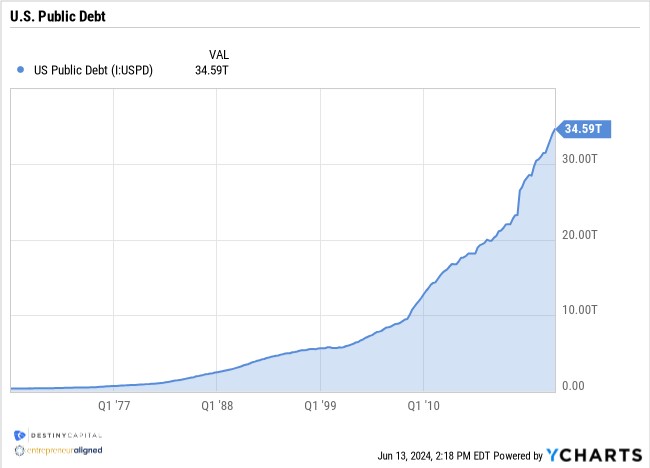
However, a few themes have emerged that are causing us some angst. First is the rapid pace at which the U.S. public debt is growing. Over the past 5-7 years, the U.S. public debt has ballooned from roughly $20 trillion to over $34.5 trillion today. This rapid ascent can be seen in the chart below that shows a sudden spike in debt that coincides with the COVID-19 crisis and all of the fiscal stimulus that resulted from the pandemic.
Now, perhaps issuing massive amounts of debt to fill the revenue deficit wasn’t quite as concerning over the past 10-15 years. After all, for much of that time, interest rates had been historically low. It’s easy to borrow when you’re only paying 1.00%-1.75% in interest. That’s practically free money.
However, due to inflation, the Federal Reserve has aggressively raised interest rates since early 2022 and this has affected the yields on U.S. Treasuries. For example, on January 1, 2020, the yield on a 10–year U.S. Treasury bond was 1.8%. Today, it is 4.3%. A 3-month Treasury bill had a yield of 1.5% in 2020. Today the 3-month Treasury bill yield is 5.51%.
A ‘real world’ comparison might be the plight of home buyers. In December of 2020, a 30-year mortgage rate hovered around 2.65%. So, a $500,000 loan at 2.65% would require a monthly payment of roughly $2,000 (not including PMI, tax, insurance, etc.). In today’s interest rate environment, the 30-year mortgage rate averages roughly 6.95%. That same $500,000 home loan now requires a $3,300 monthly payment.
What’s our point and how does this relate to the national debt? Well, the point is that the cost of servicing our national debt has skyrocketed in recent years, as seen in the chart below that illustrates U.S. Federal Government Interest Payments.
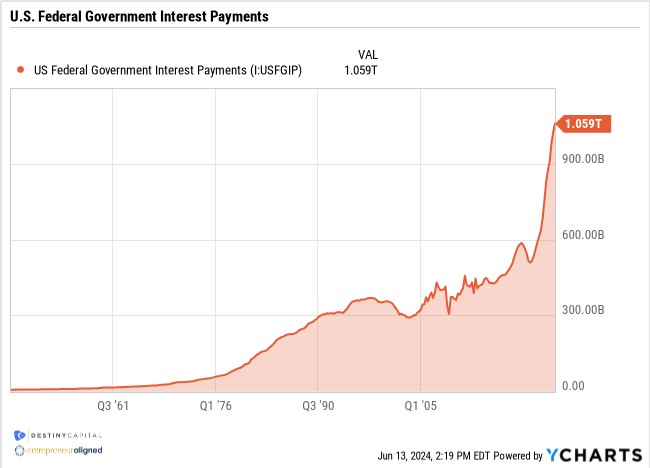
The era of ‘free money’ due to ultra-low interest rates is over. If the U.S. continues on this path of aggressive borrowing, the costs of servicing our national debt will supplant Social Security as the federal government’s 2nd largest budget item. As you’ll recall from the previous budget chart, the U.S. government is budgeted to spend roughly $1.45 trillion on Social Security in fiscal year 2024. As you can see in the chart above, the cost of servicing our nation’s debt (interest payments alone) has already exceeded $1.05 trillion. If this path continues and interest rates remain elevated, U.S. federal government interest payments may reach $1.4 to $1.5 trillion in a few short years.
A Big ‘Ask’
There’s also one other factor to mention as it relates to the annual budget shortfall and subsequent borrowing. $1.5 Trillion in U.S. Government debt is a lot for financial markets to absorb on a continuous basis. For now, there appears to be enough global demand for U.S. Treasuries at current yields in the 4.5%-5% range.
However, what happens if/when interest rates begin to fall? What happens to global demand for U.S. Treasury bonds if yields were to fall to 2%-3%? Will there be enough of a market for $1.5 to $2 trillion of U.S. debt at these lower yields? Will investors demand more compensation (ie – higher yields) in order to absorb so much debt?
Remember, U.S. Treasuries often serve as the ‘baseline’ rate for other types of debt. For example, the 30-year mortgage rate is often linked to the 10-year U.S. Treasury yield. The story is similar for newly issued corporate bonds. So, if global financial markets demand higher yields in order to perpetually purchase $1.5-$2 trillion in U.S. debt each year, that could have a cascading effect on the broader economy. This outcome is far from certain, but it’s something to keep an eye on. If the U.S. issues less debt and treasury yields decline, then this may become less of a concern.
What Will Be the Triggering Event For Change?
There appears to be very little appetite or political will to tackle some of the budgetary challenges we’re seeing today. So, this leads us to believe that there may need to be a triggering event that forces the hand of the federal government into making meaningful changes.
That triggering event could be related to Social Security. According to the Congressional Budget Office (CBO), the Social Security ‘Trust Fund’ is projected to be exhausted by fiscal year 2032, as seen in the chart below.
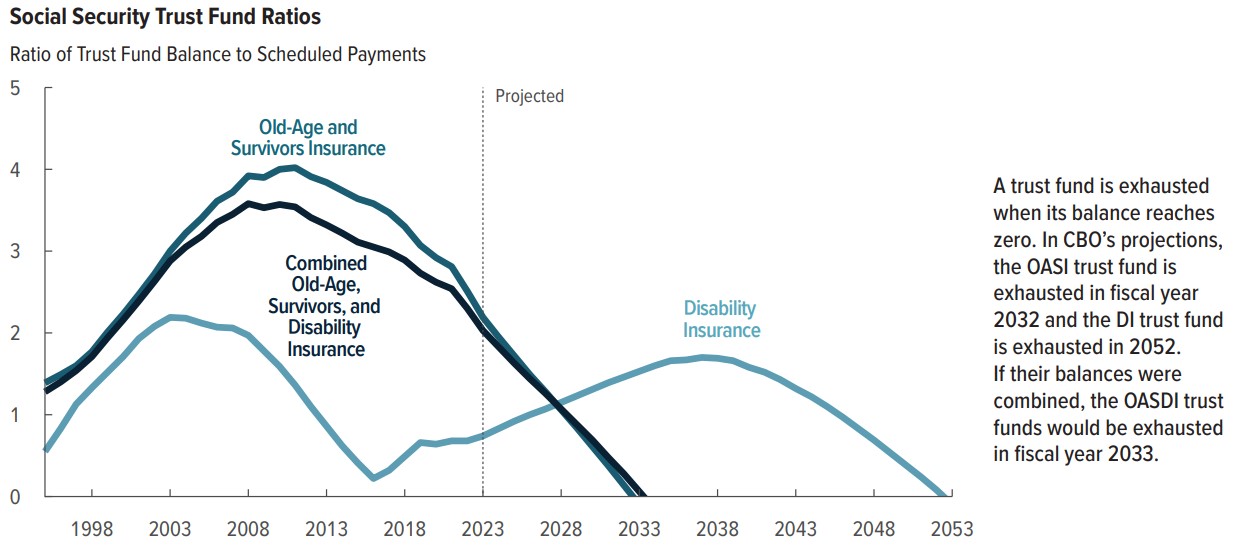
Source: The Congressional Budget Office – CBO’s 2023 Long-Term Projections for Social Security
That’s somewhat of a sobering chart to absorb, but it’s clear that there isn’t a whole lot more time for us to ‘kick the can down the road’ when it comes to certain federal budget items. According to the CBO, they project that if Social Security outlays were limited to what is payable from annual revenues, then it would result in a 25% reduction in benefits in fiscal year 2034 and beyond. The chart below breaks down the projected lifetime (not annual) benefit reduction by birth cohort. Something tells me that the voting public might not be too receptive to this potential outcome.
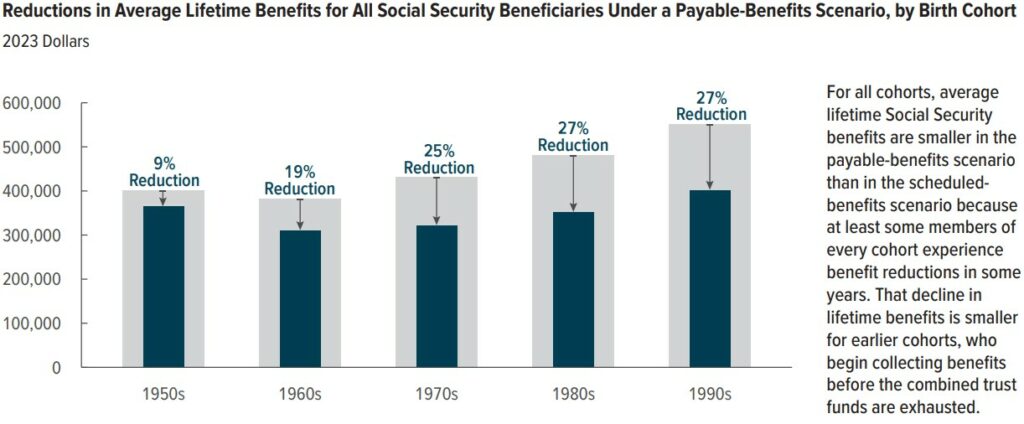
Source: The Congressional Budget Office – CBO’s 2023 Long-Term Projections for Social Security
What are the potential solutions for Social Security? Well, here are a few that may be considered:
- Raise the Social Security tax rate, which is currently 6.2% for both the employee and employer.
- Increase the cap on earnings subjected to the Social Security tax. The ‘cap’ is currently $168,000. This means that if an earner makes $250,000, then the first $168,000 of their income is taxed at 6.2% and the remaining $82,000 is not. In this example, lifting the cap to $250k (or more) could potentially make the entire $250,000 of income subjected to the 6.2% individual Social Security tax, thus raising more revenue.
- Increase the Social Security eligibility and/or full retirement age (currently 62 and 67).
- Decrease or cap annual cost of living adjustments (COLA).
- Reduce benefits for higher earners.
- Reduce benefits for ALL based on birth cohort.
- Full or partial privatization of Social Security.
Chances are that we could see a combination of some of the items above. In fact, when constructing financial plans, our Strategists and Coordinators implement a steep reduction in projected Social Security benefits for younger clients. For example, for clients ages 50 and under, we estimate a 30% reduction in the annual benefit detailed on their Social Security statement. In short, we believe that changes are coming. However, in this contentious political climate, changes likely won’t occur until the 11th hour when Social Security is on the doorstep of insolvency.
Ending on a Positive Note
While these challenges appear daunting, they are solvable. Furthermore, we don’t consider any of these budgetary elements to be of dire concern for investors over the next 1, 3 or 5 years. We consider them to be intermediate-term risks that could impact the economy and financial markets a bit further down the line.
We broach these topics because these are some of the issues we will be watching closely throughout this election cycle. We would encourage each of you to engage with your members of congress, senators and even the presidential candidates to gauge and understand what solutions they may have for the ballooning debt and the rapid rise of interest payments. Inflation has proven to us that we don’t have a ‘print money – get out jail free’ card up our sleeves.
As of this writing, we also received some positive news on inflation, as the May Consumer Price Index (CPI) report revealed that both headline and core inflation had cooled more than expected. In the CPI report released on June 12th, we learned that Headline CPI rose 3.3% vs. 3.4% expected, while Core CPI came in at 3.4% vs. 3.5% expected. As we all know, one solid report does not make a ‘trend’, and the Federal Reserve reiterated this point during their June 12th meeting. The shelter index rose 5.4% and, once again, was the largest contributor to rise in the all-items index.
When it comes to rate cuts, the Fed appears to be prepared for one 0.25% rate cut in 2024 according to their newly released economic projections. I put myself firmly in the ‘I’ll believe it when I see it’ camp when it comes to monetary policy, as the Fed has shifted the economic goalposts from meeting to meeting for nearly two years. Until then, we’ll continue to track incoming data and make portfolio adjustments as we have over time in recent years. As always, these decisions will be made with discipline and will be driven by any new and relevant data that emerges in the months ahead.
Important note and disclosure: This article is intended to be informational in nature; it should not be used as the basis for investment decisions. You should seek the advice of an investment professional who understands your particular situation before making any decisions. Investments are subject to risks, including loss of principal. Past returns are not indicative of future results. Advisory services provided by Destiny Capital Corporation, a registered investment adviser.
2024 YCharts, Inc. All Rights Reserved. YCharts, Inc. (“YCharts’) is not registered with the U.S. Securities and Exchange Commission (or with the securities regulatory authority or body of any state or any other jurisdiction) as an investment adviser, broker-dealer or in any other capacity, and does not purport to provide investment advice or make investment recommendations. This report has been generated using data manually input by the creator of this report combined with data and calculations from YCharts.com and is intended solely to assist you or your investment or other adviser(s) in conducting investment research. You should not construe this report as an offer to buy or sell, as a solicitation of an offer to buy or see, or as a recommendation to buy, sell, hold or trade, any security or other financial instrument. THE IMPORTANT DISCLOSURES FOUND AT THE END OF THIS REPORT (WHICH INCLUDE DEFINITIONS OF CERTAIN TERMS USED IN THIS REPORT) ARE AN INTEGRAL PART OF THIS REPORT AND MUST BE READ IN CONJUNCTION WITH YOUR REVIEW OF THIS REPORT. Disclosure – YCharts
Share this
Stay Ahead with Smart Investments
Learn how to invest wisely and minimize risks to protect your retirement savings.

Achieve Your Retirement Goals
Get personalized advice to meet your retirement goals. Book your call with Destiny Capital now.