Markets and Economy Update – The Concealed Carry Trade
On the morning of August 5th, I began my workday routine as usual, which typically involves some element of scrambling to get my two boys fed and out the door to camp on time. I typically work from my home office, so I grabbed a cup of coffee, sat at my desk, and checked pre-market activity to see what might be in for investors for the day. After all, the prior trading day had been quite volatile as investors digested a lackluster jobs report, so I was curious to see if cooler heads would prevail. Taking a sip, I nearly sprayed a mouthful of coffee on my monitors when I saw that the Nikkei 225 index (Japan’s version of the S&P 500) had fallen -12.4%. This was the largest single-day decline in the Nikkei 225 index since 1987, and was worse than at any point in the 2008 global financial crisis or in wake of the earthquake that led to the Fukushima Daiichi nuclear reactor disaster.
Based on Dow, S&P 500, and Nasdaq futures that morning, I could plainly see that U.S. markets were in for a painful day of trading. As trading opened, the CBOE S&P 500 Volatility Index (VIX) alarmingly spiked to over 60 – a level not seen since March of 2020 when the global economy shut down. I consider a VIX reading of 20-25 to be ‘volatile’. When the VIX reaches 30, I age roughly one year for every hour that passes. A VIX reading of 60 is almost literally off the charts. These are times when I work with an industrial size bottle of Pepto Bismol within easy reach.
I immediately began searching for news of an invasion of Taiwan by China, or all-out war between Israel and Hezbollah. Clearly, something catastrophic must’ve happened for global markets to react this way and for fear to spread so quickly. Media outlets were clawing for answers, too. The U.S. had a less-than-stellar jobs report the prior week, so pundits immediately placed blame on the U.S. economy. I saw headlines like “Global Markets Lose Faith In U.S.”, “Stocks Tank – Is A Recession Imminent?”, “Economists Call on Fed for Emergency Rate Cuts”, and on and on they went.
This is when I raised an eyebrow and thought something was amiss. Yes, the latest Bureau of Labor Statistics (BLS) jobs report showed softening in the labor market and the unemployment rate rose to 4.3% vs. the 4.1% consensus estimate. While worth noting, a single jobs report shouldn’t cause a massive global selloff in equities. To me, the ferocity of the market activity I was seeing felt anomalous – almost flash crash-like. Still, if the U.S. economy wasn’t to blame, who-or-what was? Well, this is the question we’ll answer in this month’s letter.
The Concealed Carry Trade
There are many strategies that investors can implement to potentially enhance returns. This can be done through derivatives like options and futures, through arbitrage opportunities, and much, much more. One somewhat obscure strategy that has grown in popularity in recent years is generally labeled a ‘carry trade’. This is a form of leverage where an investor borrows a currency with a very low interest rate then uses it to buy other currencies (or even riskier assets) with better yields.
What has been a stable currency with a super-low yield that can be borrowed to facilitate this type of strategy? You guessed it – the Japanese Yen. In fact, until recently, the policy rate in Japan had been negative since 2017, making it a prime currency candidate for the carry trade.
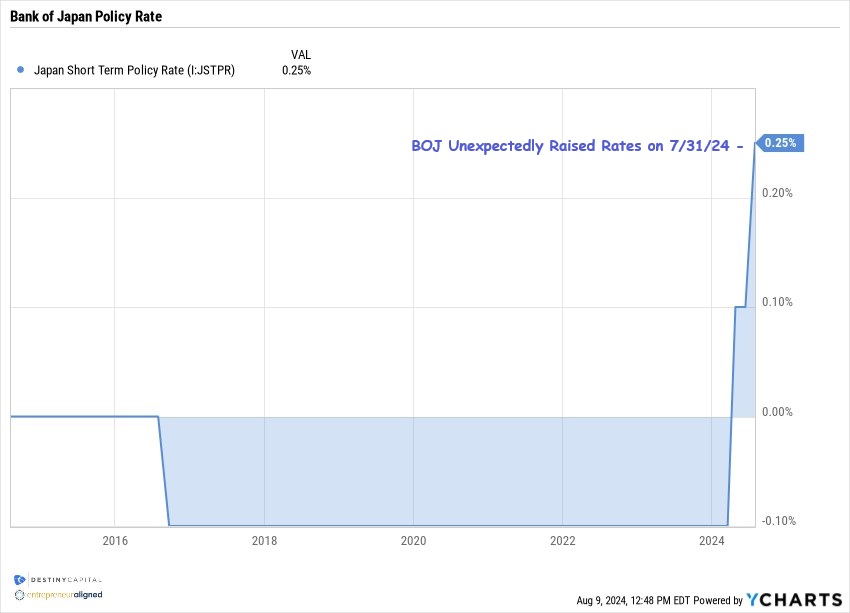
Then, on July 31st, something unexpected happened. The Bank of Japan suddenly made the hawkish decision to raise their policy rate from 0.10% to 0.25% while announcing a drastic cut in its monthly purchases of government bonds. The BOJ also indicated that it would continue to push interest rates even higher if conditions demanded it. This was done to keep prices in-check in order to stave-off inflationary pressures that had been building according to Bank of Japan Governor, Kazuo Ueda.
Central bank decisions can start to tip-over some unexpected dominoes in financial markets. If you’ll recall, the Federal Reserve’s aggressive regimen of steep rate hikes in the U.S. had a drastic impact on bond markets, particularly longer-term U.S. Treasury Bonds which sold-off over -40% between January of 2022 and October of 2023. At the time, many banks, including smaller regional banks, held significant positions in these long-term U.S. Treasury Bonds which incurred substantial losses. This helped to facilitate the banking crisis in March of 2023 that led to the collapse of Silicon Valley Bank, Signature Bank, and First Republic Bank.
Similarly, I don’t think the Bank of Japan believed that their decision to raise interest rates would help to facilitate a -12.4% selloff in the Nikkei 225 index on the Tokyo exchange, but that’s exactly what happened. Here’s how it appears to have played out:
- As we’ve indicated, for quite a while, traders have purchased higher yielding currencies (like USD) and/or riskier assets (like global stocks) and funded these purchases with Japanese Yen due to super-low interest rates in Japan. This is generally known as the ‘carry trade’.
- Traders utilized Yen because they expected the currency to remain weak and interest rates remain low for quite some time.
- On 7/31, the Bank of Japan raised interest rates, and indicated that it would continue to do so if conditions warranted it. This was sudden and somewhat unexpected. In the meantime, the Federal Reserve in the U.S. is expected to cut interest rates at its September meeting.
- The Yen rapidly appreciated nearly 8% vs. the U.S. dollar. This squeezed the ‘carry trade’, and investors who had borrowed Yen started to receive margin calls.
- Traders were required to either liquidate positions or buy more Yen, pushing the currency even higher which led to even more margin call issues.
- Traders then started to liquidate positions related to these carry trades, which caused the selloff to escalate more and more. Hence the Nikkei 225 sold off -12.4% in a day and global stock markets got rocked.
To be clear, the global sell-off was likely exacerbated by forces other than the carry trade. For example, when volatility hits, algorithmic traders could automatically exit certain positions given certain conditions, stop-losses can be triggered, and non-carry trade traders can receive margin calls. Still, it was a wild ride.
The good news is that this selloff doesn’t seem to be due to some underlying and glaring weakness in the U.S. economy. Are there cracks in the economy to monitor? Of course, but we don’t see a recession on the immediate horizon.
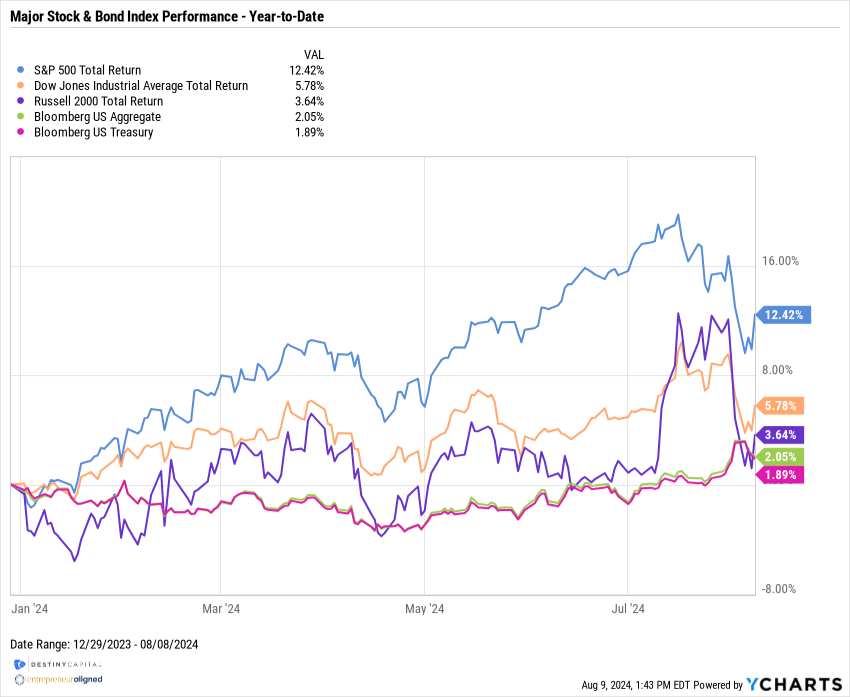
The bad news is that the carry trade continues to unwind, and it could cause additional market volatility, albeit not nearly to the extent that we saw on Monday, August 5th. Markets have also stabilized and remain positive on a year-to-date basis, as you can see in the chart below with all major stock and bond indexes in positive territory, including the S&P 500 (+12.4%), the Dow Jones Industrial Average (+5.78%), the Russell 2000 (+3.64%), U.S. Aggregate Bond Index (+2.05%) and U.S. Treasuries (+1.89%).
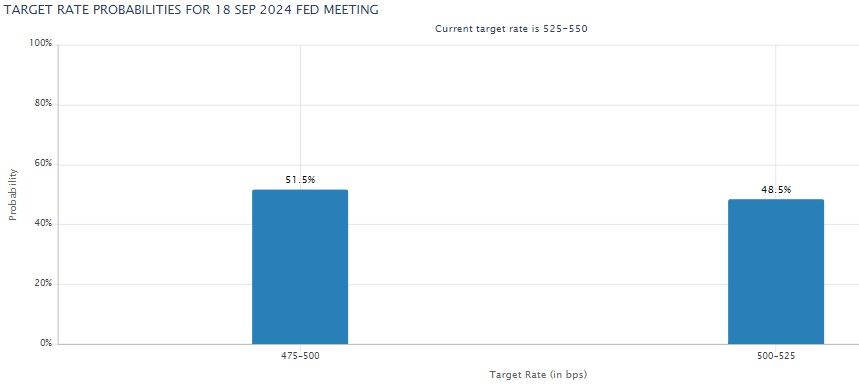
We also expect that interest rate cuts are finally here, and this should be very welcome news for borrowers and smaller companies who have been squeezed financially due to higher interest rates. In fact, investors are all but guaranteeing a rate cut at the September 18th Federal Open Market Committee (FOMC) meeting, with 48.5% of investors expecting a 0.25% rate cut, with more than half (51.5%) predicting a steeper rate cut of 0.50%, as you can see in the chart below from the CME Group’s FedWatch Tool.
We’ll still get two more CPI reports and another BLS jobs report between now and the next Fed meeting, so I expect these interest rate probabilities to be tentative. When it comes to the Fed’s dual mandate (jobs / stable prices), I still believe that they are leaning in favor of keeping inflation from experiencing an 80’s-esque ‘double spike’. A single soft jobs report will likely not scare the Fed into lowering interest rates too far, too quickly.
We are also at the end of yet another earnings season with results generally being positive across the S&P 500. With over 91% of S&P 500 companies reporting, FactSet reported that 78% of S&P 500 companies have reported earnings that have exceeded estimates. Furthermore, the current earnings growth rate is a strong 10.8% which, if this number is maintained, will be the largest year-over-year earnings growth rate since Q4 of 2021.
The next thirty to sixty days will be crucial in gauging how the year will close for investors. If inflation continues to stabilize and the labor market doesn’t weaken too much, we could see interest rates begin to normalize and we could even experience that long-awaited ‘soft landing’. However, as the saying goes, “there’s many-a-slip between a cup and a lip.” There could, for example, be geopolitical forces that may destabilize conditions, and this is something we monitor closely. The carry trade will continue to unwind – albeit with much less volatility than was experienced on August 5th. However, volatility, as measured by the CBOE S&P 500 Volatility Index still remains above 20, so investors can expect to see +/- 1% moves in the S&P 500 index until volatility ultimately quells. In the meantime, we’ll keep you apprised of any urgent developments, and please don’t hesitate to reach out to our team with any questions or needs. Year-end will be here before we know it.
Important note and disclosure: This article is intended to be informational in nature; it should not be used as the basis for investment decisions. You should seek the advice of an investment professional who understands your particular situation before making any decisions. Investments are subject to risks, including loss of principal. Past returns are not indicative of future results. Advisory services provided by Destiny Capital Corporation, a registered investment adviser.
2024 YCharts, Inc. All Rights Reserved. YCharts, Inc. (“YCharts’) is not registered with the U.S. Securities and Exchange Commission (or with the securities regulatory authority or body of any state or any other jurisdiction) as an investment adviser, broker-dealer or in any other capacity, and does not purport to provide investment advice or make investment recommendations. This report has been generated using data manually input by the creator of this report combined with data and calculations from YCharts.com and is intended solely to assist you or your investment or other adviser(s) in conducting investment research. You should not construe this report as an offer to buy or sell, as a solicitation of an offer to buy or see, or as a recommendation to buy, sell, hold or trade, any security or other financial instrument. THE IMPORTANT DISCLOSURES FOUND AT THE END OF THIS REPORT (WHICH INCLUDE DEFINITIONS OF CERTAIN TERMS USED IN THIS REPORT) ARE AN INTEGRAL PART OF THIS REPORT AND MUST BE READ IN CONJUNCTION WITH YOUR REVIEW OF THIS REPORT. Disclosure – YCharts
Share this
Stay Ahead with Smart Investments
Learn how to invest wisely and minimize risks to protect your retirement savings.

Achieve Your Retirement Goals
Get personalized advice to meet your retirement goals. Book your call with Destiny Capital now.