
Markets and Economy Update – October 2023
Whenever I think back on Halloween night from when I was a kid, I always seem to recall one object that remained persistent in my experience throughout the years – a tattered pillow case. As a toddler through about 1st or 2nd grade, I typically wore a white pillow case as some variant of a ghostly costume, while another always served as my candy-collecting bag every single year. Yes, as I got older, a little basic facepaint might’ve been introduced to my ensemble but, whenever I’ve looked through old family photo albums, it’s always been apparent that my annual Halloween costumes were, to put it mildly, quite pathetic.
Fast forward to the present day, and our eldest son entered a public school that houses grades 1 through 4. In late October, all parents and relatives were invited to his school for a little Halloween parade followed by a ‘trunk or treat’ celebration later that evening. As my wife and I canvassed these events, my jaw nearly hit the floor when I saw many of the costumes as the children wandered by. “I feel like we’re on a movie set,” I covertly mumbled to my wife. Many of the costumes were so realistic and detailed that half the kids could’ve served as mini little extras in The Mandalorian or one of the many Marvel blockbusters. I started to feel a little insecure about our 3-year-old who was dropped off at his pre-school that morning dressed as, you guessed it, a plain ol’ white ghost.
There’s a theme that permeates many of the topics we’re going to cover throughout this month’s letter, and that theme is related to spending & debt. Based on my experience at my son’s school, I was fascinated to uncover the chart below that shows the expected ‘total spend’ on Halloween-related items in the U.S. is expected to total $12.2 billion in 2023. That’s up from $3.3 billion in 2005. That equates to an expected total-spend of $108 per person, which is undoubtedly far above the $0.13 cents (inflation adjusted) that my parents spent on my Halloween costumes back in my youth.
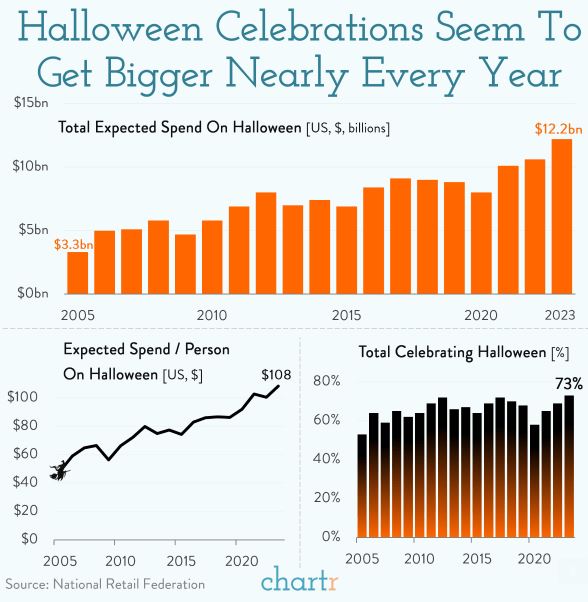
Source: Chartr / National Retail Federation
Whether it be inflation, the prospect of a government shutdown, restrictive monetary policy, a rise in the 10-year U.S. Treasury yield, consumer spending or strong U.S. GDP, it’s clear that each of these topics are all related to spending in one way, shape, or form.
In fact, many of these items are interrelated and quite complicated. So, we’ll take a 30,000 ft view of some of these topics, and we’ll begin this month’s letter with something that is not at all polarizing in any way – government spending and government debt.
Government Spending & Debt – Just the Facts Ma’am
Disclaimer: when it comes to commenting on a topic like government spending (or government anything, for that matter), I attempt to handle it like Joe Friday from the old late-60’s series (or 80’s movie) Dragnet, when Joe would ask for “Just the facts, ma’am”.
Regardless of political stance, it probably doesn’t come as much of a surprise to anyone these days that the U.S. government runs at a budget deficit. This is just like any individual or household who spends more than they take-in through salary or any other income sources each year.
As you can see in the chart below that summarizes the 2023 fiscal year budget (10/01/22-09/30/2023), total government spending was budgeted to be $6.2 trillion for items like Defense, Social Security, Medicare & Medicaid, and more as you can see on the left side of the chart below.
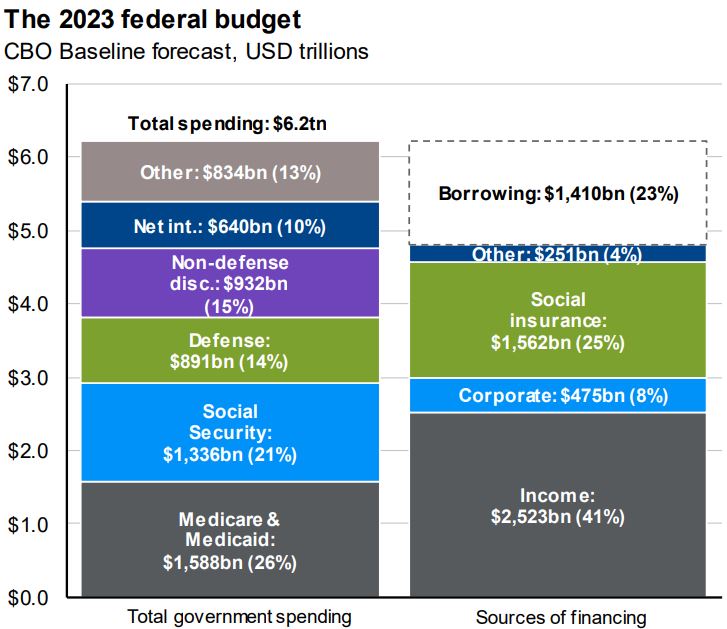
Source: Congressional Budget Office / JP Morgan Guide to the Markets
However, the sources of government revenue like individual & corporate taxes, social insurance payments and so forth only equate to about $4.79 trillion dollars in fiscal year 2023. This leaves a gap of about $1.41 trillion dollars that must be filled through borrowing, and the U.S. government borrows money by issuing Treasury bills, notes, bonds, TIPS, and so forth. Deficits are nothing new. In fact, the last time the U.S. government operated with a budget surplus was back in 2001.
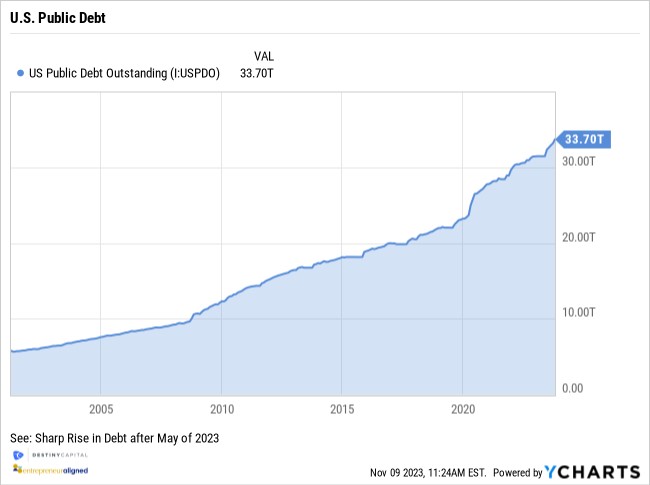
If a government operates at a deficit year-over-year and needs to keep perpetually borrowing through debt issuance, that debt will accumulate over time. This minacious fact is illustrated in the chart below which shows that the U.S. public debt now stands at $33.7 trillion dollars as-of October 2023.
What does this mean for investors? Well, as I alluded to earlier, many of these spending and debt issues are interrelated, and this is where we’ll dive into some of these relationships. We’ll start with how spending has impacted Treasury yields, and how these Treasury yields have impacted bond markets over the past few months.
Government Debt, Treasuries Yields, and Bond Prices
Looking at the public debt chart above is a lot like peering at the sun. At a simple glance, there’s some discomfort, but the longer you look, the more painful it feels. Since the early 2000’s, we see a few instances where debt surges a bit, and those instances tend to occur around events like the 2008 Financial Crisis or the 2020 COVID-19 pandemic. Those surges can be explained away a bit given the severity of those events and the subsequent government intervention.
However, markets recently appeared to take note when, after the debt ceiling standoff that concluded in early June, we saw a sudden spike in U.S. Treasury issuance, which added over $1 trillion to the public debt in just a few short months. This rise can be seen on the US Public Debt chart above, as well.
Each quarter, the U.S. Treasury announces debt issuance intentions through what’s called the Quarterly Refunding Process. Historically, this process has been a rather benign non-event in the eyes of investors. The government needs money. The government borrows money. Markets absorb the newly issued debt with plenty of buyers. Rinse and repeat over time.
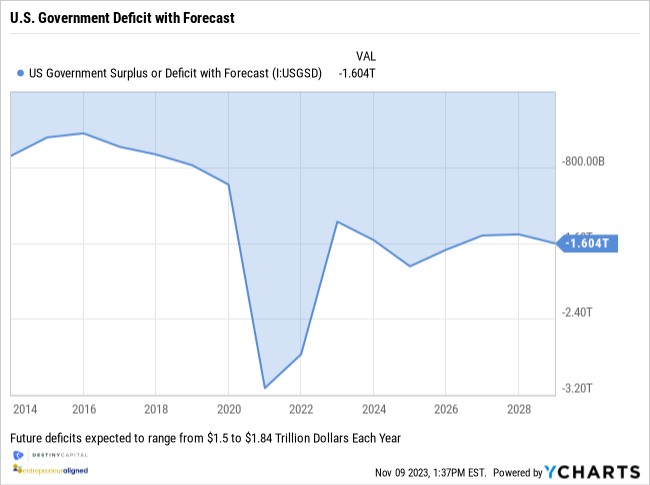
However, markets began to wonder if this recent surge in debt was a blip on the radar, or a true sign of things to come. After all, U.S. government budget forecasts predict annual deficits that are expected to range between $1.50 trillion to $1.84 trillion dollars over the next several years. You can see this in the chart below that shows historical deficits back to 2014 with deficit projections out through 2028.
I know we throw around lots of dollar figures beginning with B’s and T’s these days without thinking too much about it. We’ve got corporations like Apple with a $2.85 trillion dollar market cap. We’ve got CEOs worth many, many billions of dollars. Heck, we’ve got a cryptocurrency like Bitcoin with a market cap of over $700 billion dollars.
Still, $1.5 trillion is an awful lot of money to raise via debt issuance year-after-year. It’s a lot of debt for markets to absorb, particularly when the Fed is trimming its balance sheet (selling, not buying), and other central banks are diversifying their holdings. Not to mention the fact that Standard & Poor’s downgraded the U.S. sovereign credit rating from AAA to AA+ in 2011, while another key credit ratings agency, Fitch, did the same in 2023.
What may need to happen when debt supply is high, demand may be falling, and the underlying credit risk has risen as intimated by the recent U.S. credit rating downgrade? Well, investors may require greater compensation to drive demand for U.S. government bills, notes, and bonds. What does that compensation come in the form of? You guessed it – investors may need to see higher interest rates on debt issued by the United States in order to consistently attract enough buyers year-after-year.
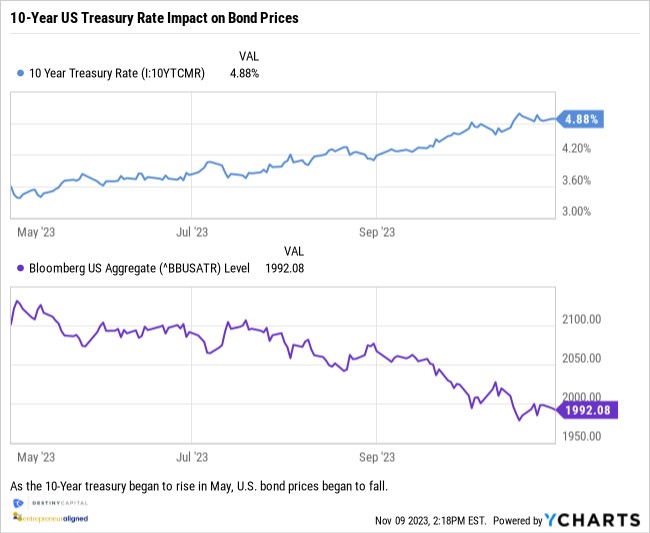
So, due to many reasons, including the above assumptions about supply, demand, and credit risk, we saw the 10-year Treasury rates rise precipitously from roughly 3.50% in May of 2023 to nearly 5.00% by late October 2023.
What happens when interest rates rise? Bond prices fall, and we can see this relationship illustrated in the chart below with the top chart (blue line) illustrating the rise in the 10-year U.S. Treasury rate. Meanwhile the chart on the bottom (purple line) shows the price decline in the Bloomberg U.S. Aggregate bond index over the same time period between May 1st and October 31st of 2023.
The recent surge in the 10-year Treasury has continued the struggles for the overall bond market which, over the past 5-years, has now produced negative returns, as seen in the chart below.
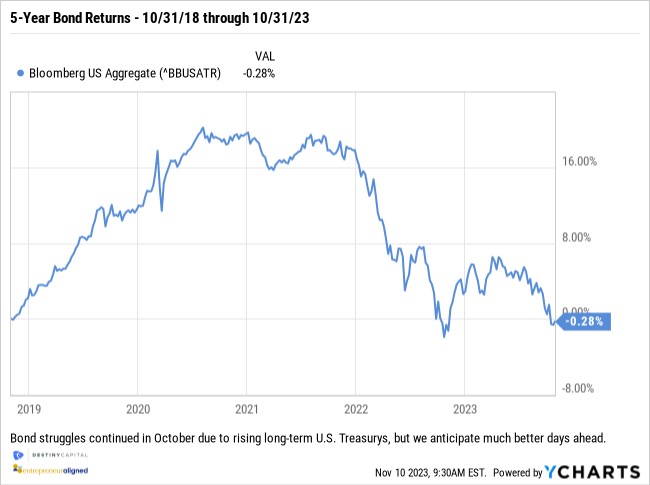
While frustrating in the near-term for bond investors, we foresee much better days ahead for bonds as interest rates ultimately normalize (fall), which would cause a surge in bond prices in the months ahead. Yet, bonds weren’t the only asset class impacted by spending and debt in recent weeks, so we’ll touch-on the stock market next.
Stock Market Impact
In yet another twist, we turn to the impact of the recent spike in government debt on inflation, monetary (Fed) policy and the stock market.
By now, we are all familiar with the inflation story that’s unfolded over the last few years. If not, let me quickly summarize. During and after the COVID-19 pandemic, easy monetary policy, fiscal stimulus, pent-up demand and more all contributed to inflation that soared over 9% by June of 2022. To combat inflation, the Fed aggressively raised the lower limit of the fed funds rate target from 0.00% in April of 2022 to 4.25% by December of 2022.
Over the course of 2023, the Fed has incrementally and periodically raised rates as inflation data emerged, and the effective federal funds rate now stands at 5.30%. Inflation fell from those 9% highs in June of 2022 to roughly 3.7% by September of 2023, yet, markets are still left wondering “will the Fed continue to pause interest rate hikes and, if so, when will rates begin to fall?”
Well, ironically, the debt-driven rise in the 10-year Treasury yield may help to answer those questions.
Once again, let’s consider some of the factors that led to the rise in the 10-year U.S. Treasury rate from May through the end of October. These factors included the outlook for government spending, the Fitch credit downgrade, elevated levels of U.S. debt issuance to cover persistent budget deficits, waning global Treasury demand, and more.
By contributing to the rise in the 10-year U.S. Treasury rate, these inputs may have an indirect impact on inflation and, subsequently, the trajectory of monetary policy as we head into 2024.
Why may these inputs have a direct impact on inflation? Well, the 10-year Treasury is often used as a baseline or barometer from which other debt instruments are compared. If a 10-year U.S. Treasury is generally viewed as virtually ‘risk free’, then all other debt would require a premium above and beyond the 10-year Treasury yield in order to justify investment.
As an example, we’ll look at the basic relationship between the 10-year U.S. Treasury and the 30-year mortgage rate. By looking at the chart below, it’s pretty easy to identify a general correlation between the 10-year U.S. Treasury rate and 30-year mortgage rates.
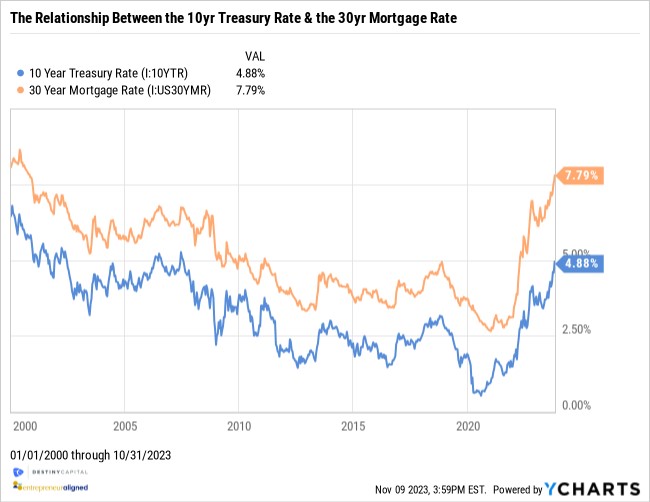
With mortgages, the 10-year U.S. Treasury tends to serve as a baseline rate for the lender, and the borrower will need to pay a premium above and beyond the 10-year Treasury in order to justify the loan. Relationships to the 10-year Treasury like this exist across the financial spectrum, so there’s a broad economic effect when the 10-year Treasury rate rises or falls.
Let’s also not forget that higher mortgage rates, driven by a higher 10-year Treasury rate, may foster reduced demand for homes. Reduced demand could eventually lead to lower prices. For a number of reasons, housing (shelter) has remained one of the most persistent elements of inflation over the past 18-24 months, and housing happens to be the largest contributor (44.4%) to the overall inflation (CPI), as you can see in the pie chart below.
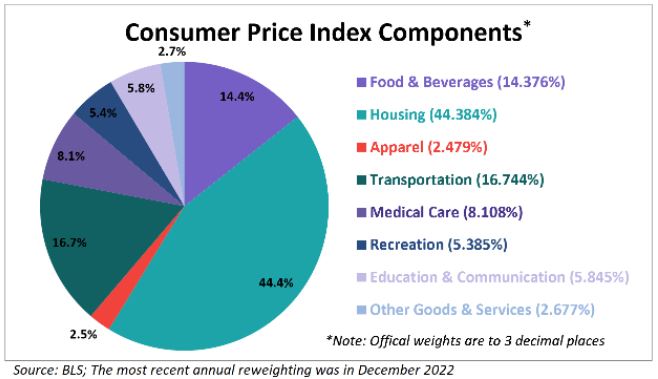
Source: Advisorperspectives.com / Bureau of Labor Statistics
So, by impacting affordability for home-buyers, the rise in the 10-year Treasury could be doing some of the Fed’s work for them in combating inflation and setting the stage for a permanent pause in rate hikes.
In fact, immediately after the last Fed meeting on November 2nd, Jerome Powell stated, “perhaps the most important thing is that these higher Treasury yields are showing through a higher borrowing cost for households and businesses and those higher costs are going to weigh on economic activity to the extent this tightening persists and the mind’s eye goes to the 8 percent, near 8 percent mortgage rate, which could have pretty significant effect on housing.”
Is Powell indicating that a 10-year Treasury rate hovering between 4.50% and 5% is ‘sufficiently restrictive’ enough to meet the Fed’s inflation objectives? At this point, it appears as though investors interpreted the comment above, along with many others that day, as a sign that the Fed is done raising interest rates. This is something that markets have been pining for over the past twelve months and, at least in the very short-term, investors have reacted positively with markets ascending since the Fed concluded its latest meeting on November 2nd.
Where Do We Go From Here?
That was quite the spending-related rabbit hole we dove into, but it is a topic that seems to reverberate across the economic spectrum right now, so I thought it was important to provide some perspective.
We have yet to even mention the prospect of a government shutdown that could materialize if an agreement is not reached by November 17th, and many of the disagreements at the heart of that debate are related to spending and debt in some way.
When people see the U.S. debt figures reaching $33 trillion, they often say it’s quite sobering. For me it’s quite the opposite, as it makes me want to reach for the nearest glass of wine. All kidding aside, we often get questions about whether or not this ballooning debt is a ticking time bomb for the economy. The answer is – probably not in the short term. If you look at a country like Japan, they’ve been operating with debt that’s been over 100% of the country’s gross domestic product (GDP) since the year 2000. Currently, their debt is well-above 200% of GDP, as seen in the chart below. Comparatively, the U.S. debt is currently about 118% of GDP and has been declining slightly since 2020.
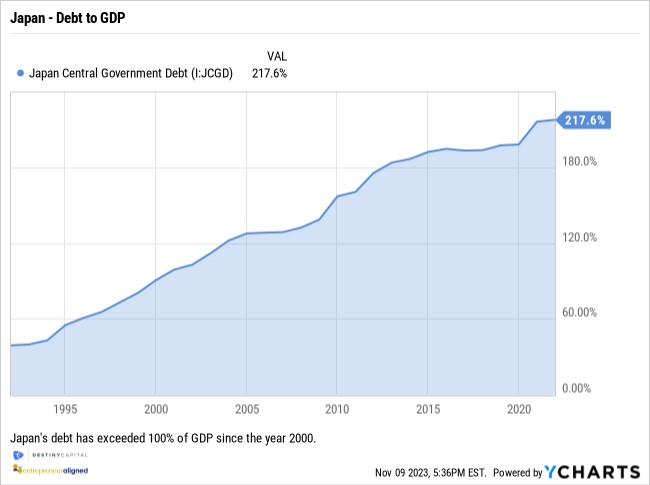
While the U.S. and Japanese economies are different in many ways, this at least helps to illustrate that the U.S. is not necessarily about to fall off a proverbial fiscal cliff. Having said that, it’s hard to deny that the current state of borrowing is untenable over the long term.
Remember, higher Treasury rates means that the cost of servicing debt has and will increase over time. Over the past decade or so, the U.S. was able to borrow at extremely low rates. On December 31, 2021, the 1-year U.S. Treasury was 0.39%, the 5-year was 1.26%, and the 10-year was 1.52%. That’s about as close to free money as you can get.
Today, the environment is entirely different, and this becomes starkly evident in the chart below that shows that U.S. government debt servicing interest payments rose to another all-time annualized high of $1.28 trillion dollars by Q3 2023.
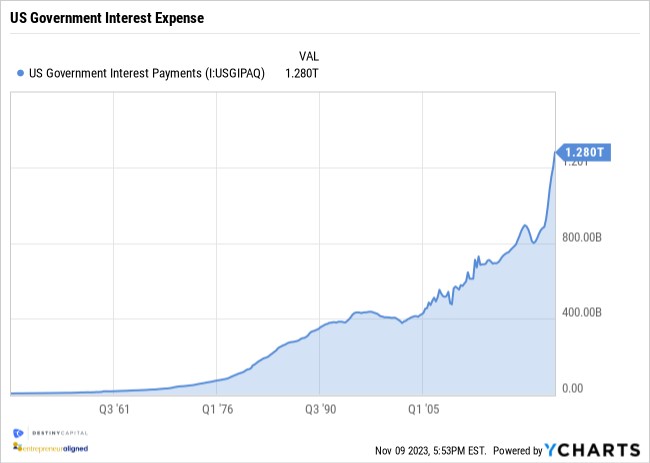
If the trend above continues, then debt servicing will overtake Medicare & Medicaid as the government’s largest budget expense.
I communicate all of this not to alarm or incite anyone, but to simply make everyone aware of some of these key data points and how they may impact investors both now and in the future. We anticipate that interest rates will fall over time. While far from a panacea, this will likely positively impact the cost of potential debt servicing in the years ahead while also providing some potential tailwinds for stock and bond markets.
Furthermore, as of this writing, we’ve seen the 10-year Treasury rate fall largely because the U.S. Treasury recently announced that they expect to issue less debt in Q4 of 2023 than markets anticipated, and this was broadly received as welcome news, and this relaxed some of the upward pressure on longer-term U.S. Treasury rates.
There is plenty more we could cover this month, but this is quite a lot to absorb. I hope it also goes without saying that we are keeping a watchful eye on the war in Israel. This is a tragic situation that can change minute by minute, hour by hour, and day by day, so it’s something we track very closely.
We also will get our next Consumer Price Index (CPI) report on November 14th. Markets are predicting headline CPI of 3.7% and core CPI of 4.1%, which would indicate a sideways move in inflation since the September report (released in October). Will falling energy prices have a positive impact on CPI this month? We shall see. We are also keeping a close eye on a potential government shutdown, which, without a resolution, would come to a head on November 17th. Therefore, the first few weeks of November are bound to be quite eventful, and we’ll keep you apprised of any changes that might impact our outlook for investors.
Important note and disclosure: This article is intended to be informational in nature; it should not be used as the basis for investment decisions. You should seek the advice of an investment professional who understands your particular situation before making any decisions. Investments are subject to risks, including loss of principal. Past returns are not indicative of future results.
Advisory services provided by Destiny Capital Corporation, a Registered Investment Adviser.
Share this
Stay Ahead with Smart Investments
Learn how to invest wisely and minimize risks to protect your retirement savings.

Achieve Your Retirement Goals
Get personalized advice to meet your retirement goals. Book your call with Destiny Capital now.