Markets and Economy Update – June 2023
As a kid back in the late 80’s, I hit a growth spurt that finally caught me up in size to most of the other kids in my class. I shed a few spare pounds, grew several inches, and became singularly obsessed with one thing – playing basketball. Around that same time, I would watch another unassuming, relatively short New Jersey kid, Bobby Hurley, as he’d dribble and weave through defenses for the Duke Blue Devils. Inspired by this talent, I’d spend hour upon hour working on dribbling drills in my basement. During the winter months, I’d shovel snow and chip ice off my parent’s driveway just so I could work on my shot.
In grade school, I became a solid player and never saw a three pointer I didn’t like. Then, as I entered high school, I began to hear nervous rumblings about my school’s Junior Varsity coach. He was known to be tough and demanding, to put it kindly. “He made Bobby Knight look like Mother Teresa,” is a line that I’ve since used in describing my experience on that team. For those of you who are unfamiliar with ex-Army/Indiana/Texas Tech coach Bobby Knight, he was known for his demanding, intense, and often-confrontational coaching style. In the case of my high school JV coach, I would come to find out that the rumors of his Knight-esque style were very true.
I was relegated to the JV team my sophomore year, and our coach yelled and yelled and yelled, and we ran, and, and ran. We seemingly could do nothing right. An error, real or invented, would have us on the end line of the court to run ladders (called suicides back in those days) until someone inevitably vomited, then we’d run some more. I must admit, the coaching style was initially effective. Our entire team reached the regular season in incredible shape, we were disciplined, we played tremendous defense, and we lived in abject terror of somehow disappointing our coach. However, over time, that dynamic began to change as the season progressed. Our coach grew increasingly unpredictable, and would continue to uncover fault in just about everything we did. By then, we could run for days, so the wind-sprints were no longer the punishment they had been. His furor seemed boundless, yet the effect of this furor ultimately waned. Perhaps it was self-preservation, but we began to subconsciously tune him out, and he ultimately lost the locker room.
Over the past few months, I think we’ve started to see a similar dynamic play out between investors and the Federal Reserve. Since early 2022, an unpredictable Fed has had investors on-edge as the Federal Open Market Committee has continued to squeeze the economy through tighter and tougher monetary policy. The Fed has been overtly hawkish in their commentary, instilling fear and uncertainty as they insist that short-term pain will avert a long-term catastrophe. Meanwhile, investors have lived in a state of perpetual fear of an event, a report, or a data point that might set-off the Fed and push rates even higher.
Then, after the June 2023 Federal Open Market Committee (FOMC) meeting, the Fed released projections implying that even more rate hikes are expected in the second half of 2023. Much like with my old JV coach, investors met this news with a bit of an eye roll and a shrug. Yet another FOMC meeting, and another overtly hawkish message. Been there, seen that. Clearly, investors can’t ignore the Fed so, in this month’s letter, we’ll talk a little bit about what’s driving the markets this year and what assets are holding back investor portfolios at the halfway point of the calendar year. We’ll begin with some of the driving forces that have pushed markets higher.
Driving Forces – Is the S&P 500 Getting Top Heavy?
At the halfway point of the year, the S&P 500 index has posted strong numbers, with returns up roughly +15% year-to-date (YTD). I think if I polled most investment managers at the beginning of 2023, we would’ve seen very few predicting such a strong return at this stage. What has been the driving force behind the rebound in the index?
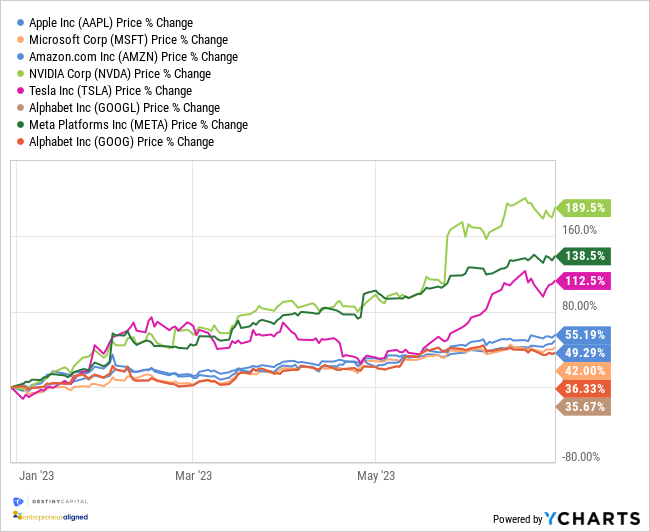
Well, when dissecting the source of these strong YTD returns, we don’t have to look very far. In fact, we don’t really have to look far beyond the top 8 holdings of the S&P 500 index, namely Apple, Microsoft, Amazon, NVIDIA, Tesla, Alphabet (Google A-share and C-share), and Meta (formerly Facebook). The YTD performance of these eight stocks has been somewhat staggering, as seen in the chart below with NVIDIA up +189%, Meta up +135%, Tesla up +112%, and the rest falling between +35% and +55%.
2023 YTD Performance – Top 8 S&P 500 Stocks
It’s also important to note that the S&P 500 is a market-cap weighted index. This means that a company’s market cap (its stock price multiplied by its # of shares outstanding) dictates a stock’s weighting within the index. So, as the price for each of these stocks has increased, its weight as a percentage of the S&P 500 index has also increased. This can cause the S&P 500 index to get a bit ‘top heavy’, meaning that the small handful of mega-cap companies above can disproportionately impact the direction of the entire index. The chart below illustrates this dynamic by showing the weight of the top 10 stocks as a percentage of the S&P 500 index over time.
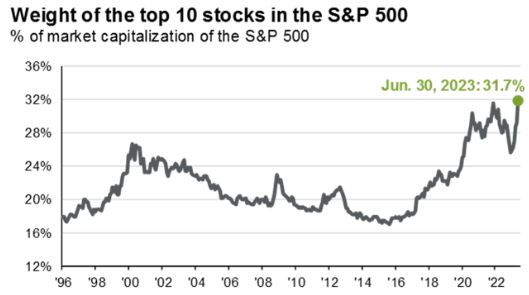
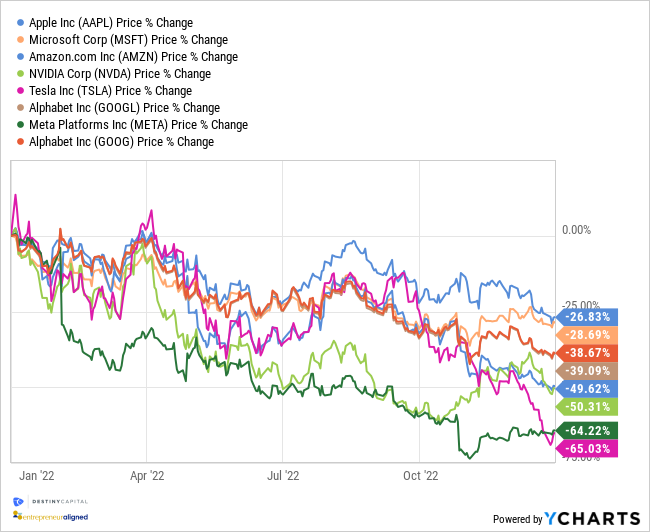
As we can see above, we are reaching all time highs where the top 10 stocks make up roughly 32% of the entire index. That means that the remaining 68% of the index is represented by 490 other companies. Clearly, when times are good for these mega cap companies, that can be a good thing for investors. However, we only have to look back at 2022 to find a time where this top-heavy concentration negatively impacted the index, as you can see in the chart below.
2022 Performance – Top 8 S&P 500 Stocks
How can we gauge how the rest of the market is really doing beyond these top few companies? Well, one method we can utilize would be to view the S&P 500 through an equal-weighted lens where we look at the YTD performance of the index where all 500 companies are given equal representation in the index (100% / 500 companies = 0.20% weight per stock).
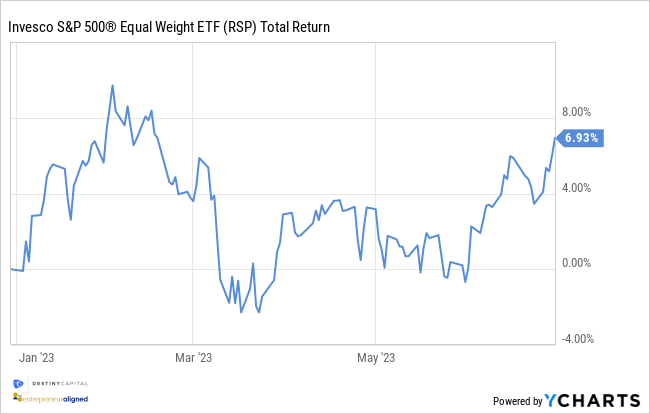
To view this, we’ll look at the Invesco S&P 500 Equal Weight ETF (ticker: RSP) that, as the name implies, equally weights all 500 S&P companies held in the fund. This can help to remove some of the performance skew due to the top-heavy nature of the market cap weighted S&P 500. As you can see in the chart below, YTD performance of the market cap weighted index falls from over +15% to roughly +6% for the equal weight version. While the +6% return for the equal-weight S&P is somewhat strong, it’s not +15%, and helps to illustrate the positive effect (for now) that the top-8 S&P 500 companies are having on overall performance.
2023 YTD Performance – Invesco Equal Weight S&P 500 ETF
What’s causing the YTD performance of these top 8 companies? Well, for starters, earnings have generally been better than anticipated and investor outlook has improved quite a bit in recent months as, among other things, the labor market remains resilient despite such aggressive and unpredictable Fed policy. However, in addition to solid earnings, most of these companies also are projected to have some kind of research and development devoted to Artificial Intelligence (AI), which is a technology that has captured the imagination of investors ever since ChatGPT emerged as such a powerful innovation.
Is this elevated performance sustainable, or are we seeing a bit of ‘irrational exuberance’, to quote ex Fed Chairman Alan Greenspan? In the case of most of these companies, it’s hard to deny that they’ll be leading innovators in AI (along with other pursuits) in the years ahead, either through innovation or acquisition. However, a company like NVIDIA appears to be getting a bit frothy, as we’ve seen their price-to-earnings (P/E) ratio shoot from around 50 to 222 in just a few short months, as seen in the chart below.
NVIDIA – P/E Ratio
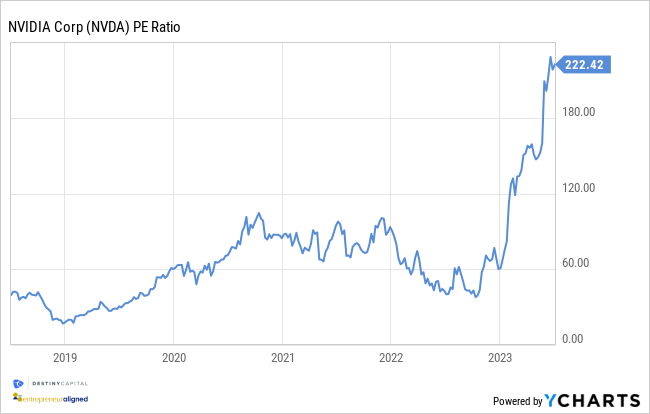
This means that an investor is willing to spend $222 for each dollar of NVIDIA earnings. While stocks with tremendous growth potential often trade at significant P/E multiples, this stock appears to be ‘priced to perfection’.
When looking at broader markets, and while these companies are providing a short-term performance boost, it’s important to note that this level of concentration can also add to volatility to the downside. Should one or more of these companies falter and underperform during future quarterly earnings reports, we could see added volatility in the index as a whole.
Portfolio Anchors
While we’ve spent quite a bit of time talking about tailwinds for investor portfolios, it’s also important to stress that portfolios are intended to be diversified, and not all asset classes are ascending to the level of the S&P 500 to-date. As we’ve already indicated, performance outside of the top 8 S&P 500 companies, while positive, has been somewhat muted in comparison.
Until the beginning of June, small cap ($250 million to $2 billion in marketcap) and mid cap ($2 to $10 billion market cap) companies struggled, with performance barely hovering in positive territory throughout most of 2023. However, in June, these mid and small cap stocks experienced a welcome boost and now hover between +5% to +7% YTD, depending on the trading day.
Throughout the past year, we also saw the price of gold ascend from the lows of early November 2022 through early May of 2023. However, we’ve since seen the price of gold level-off a bit and, as an asset class, it remains up roughly +5% as-of the end of June. Solid, yet not spectacular.
We then move on to bond markets, which continue to be hamstrung by constant changes in Fed policy. After their March 2023 meeting, the FOMC released projection materials that indicated a year-end 2023 fed funds target rate of 5.10%. That was the same projection that they had released after their December of 2022 meeting. Therefore, most investors had come to believe that the Fed was at the end of its cycle of perpetual rate hikes.
Then, unexpectedly, after their June 2023 meeting, the FOMC announced that its year-end 2023 interest rate target had risen yet again from 5.10% to 5.60%, thus indicating another 0.50% of rate hikes are anticipated between now and the December 13th Fed meeting.
This caused a dejected sigh across the land among bond investors, as changing interest rate policy continues to negatively affect bond prices. As such, the US Aggregate Bond market ended June up just +2.09%. However, it’s important to note that, while interest rate risk remains due to changing Fed policy, investors are being compensated for this risk in the form of yields that are as high as we’ve seen, across the board, in over a decade. This can be seen in the chart below with the blue diamonds representing recent yields and the purple line representing the 10-year median yield for various bond investments.
Fixed Income Sector Yields
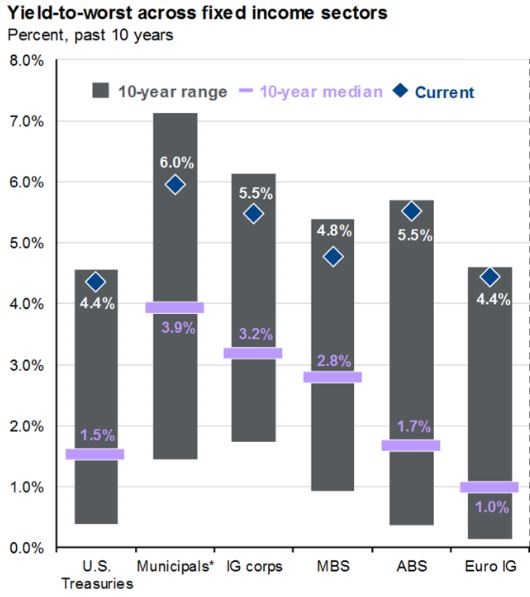
Source: JP Morgan Asset Management
In today’s marketplace, we see high quality corporate bonds with yields between 5% and 6%, with lower-quality, high yield bonds paying roughly 8.25%. At the beginning of 2022, equivalent bonds were producing less than half of the yields available now.
Furthermore, it’s important to note that interest rates will inevitably decline at some point, as a fed funds rate north of 5% simply isn’t tenable over the long term. We are seeing substantial progress in the fight against inflation, as we’ll get into next, and we expect interest rates to revert back to the Fed’s long-term target of 2.5%. As that happens, our data anticipates that we could see bond prices ascend – significantly, in some cases – and bonds could outperform stocks for a time, much like they did in 2019 when the Fed suddenly lowered interest rates in the midst of a rate hike cycle. As such, we are preparing client portfolios to benefit from this likely transition back to lower rates, and we’ll be communicating more about this in the weeks ahead.
Inflation, GDP Growth and Jobs
We’ll close this month’s letter with brief updates on key components of the economy that could influence investment strategy over the weeks and months ahead, beginning with inflation.
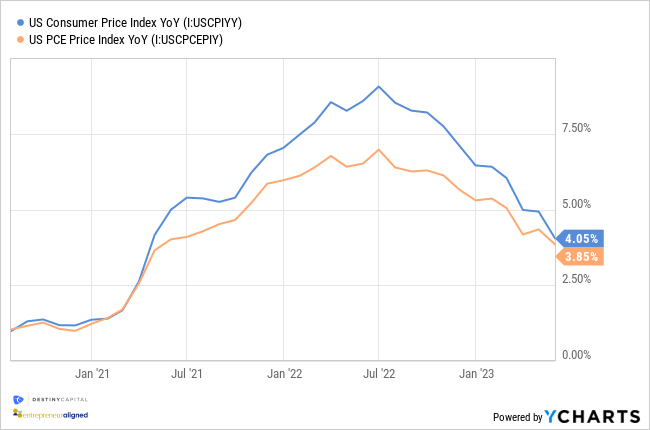
Over the past 18 months, the U.S. has made substantial progress toward lowering inflation back to the Fed’s 2% long-term target. The chart below illustrates this progress through the year-over-year Consumer Price Index (CPI) and Personal Consumption Expenditure (PCE) figures, with PCE being the Fed’s preferred measure of inflation at 3.8% after the May PCE report released in late June.
CPI and PCE Growth – July 2021 through Current
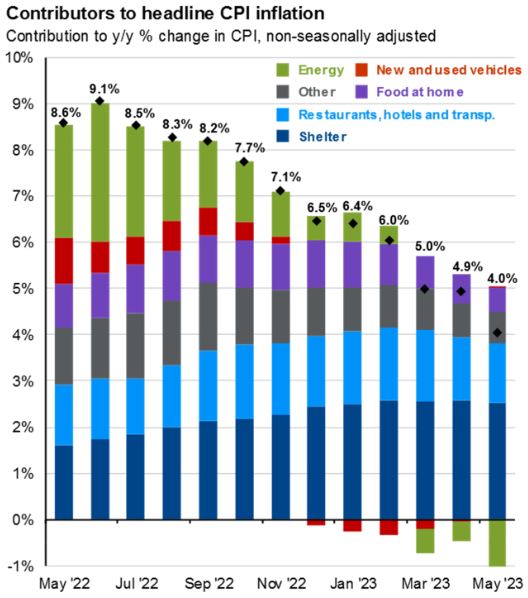
Economists expect inflation will continue to fall, but the path back to 2% could lead us well into 2024 as the more stubborn elements of inflation eventually decline closer to target levels. What are the components of inflation that remain persistent? Well, the chart below helps to illustrate this and shows that, while most other inflation components have made significant progress, the Shelter index continues to be a thorn in the side of economists, investors and consumers.
Beyond the Shelter index, the Fed has also stressed the importance of making progress on prices in Core Services Ex-Shelter, which represents a diverse group of inputs. The chart below helps to illustrate the progress, or lack thereof in some cases, in these areas.
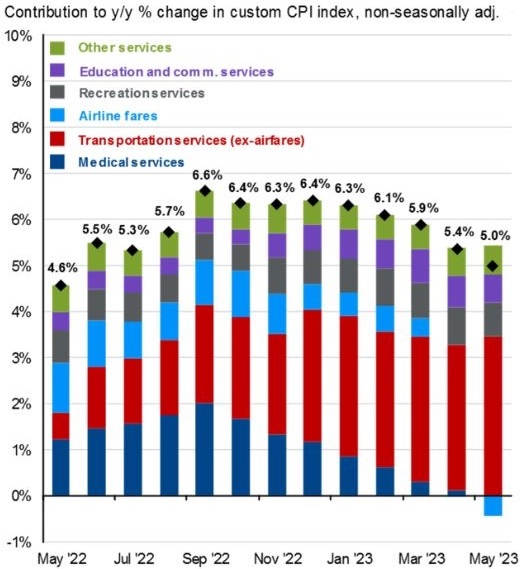
While there has been progress made in the costs of airline fares (you could’ve fooled me), other elements of core services ex-housing remain stubborn, particularly transportation services excluding airfares, which have increased substantially over the past year.
Regardless, I think most investors and economists are generally pleased with the progress that has been made on inflation, with the domestic economy remaining resilient in spite of the Fed’s best efforts to quash demand and squeeze growth into submission.
To help measure economic resilience, we’ll briefly look to Gross Domestic Product (GDP) growth and the labor market. In June, we received a revised Q1 2023 GDP figure that lifted GDP from the initial 1.3% reading up to 2.0%. Looking ahead, the Atlanta Fed predicts Q2 2023 GDP of 2.1%, as seen in the chart below.
Atlanta Fed – Q2 2023 GDP Estimate
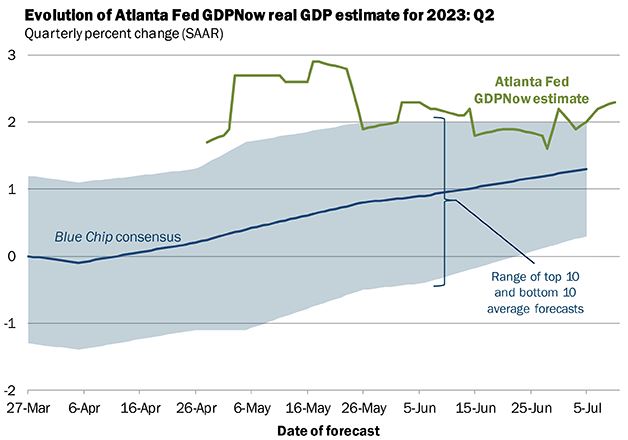
Source: Atlanta Fed – GDPNow Tool
I’ve heard from a few trusted economists whose models are projecting that Q2 2023 GDP could end up 3.0% or slightly higher. While these are hardly scintillating GDP numbers and growth is expected to cool over the coming quarters, GDP continues to surprise to the upside, and we’ll be tracking our GDP estimates closely each day to see if a reversal of that trend emerges.
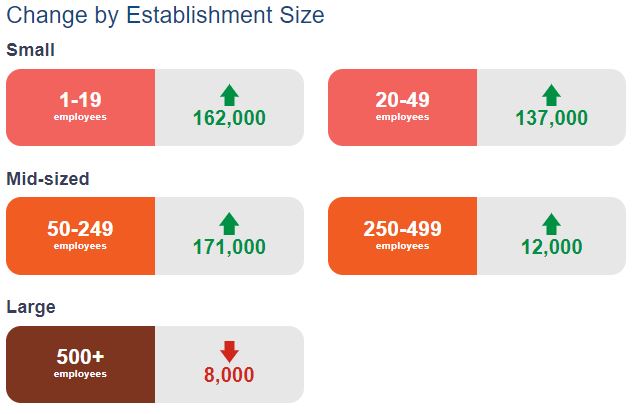
We’ll close this month’s letter with the element of the U.S. economy that has proven the most resilient throughout the Fed’s rate-hike cycle – the labor market. HR management software company, ADP, released their June private employment report, indicating that 497,000 private sector jobs were added in the month of June. This figure was well above the consensus estimate of 235,000. Based on the report, it’s apparent that small to mid-size companies generated the most demand for workers, as we can see in the illustration below.
Jobs Added in June 2023 – By Company Size
In the Bureau of Labor Statistics June report, nonfarm payrolls rose to 209,000 jobs, while the unemployment rate fell slightly from 3.7% to 3.6%. The Job Openings and Labor Turnover Survey (JOLTS) report indicated that there are 9.8 million job openings in America, or nearly two jobs for every job seeker. While most news coming from the labor market is positive, one of the data points that we are tracking closely is initial jobless claims. Initial jobless claims, reported weekly, have been slightly elevated over the first half of the year, but still well below levels that might cause a sudden spike in unemployment.
Ultimately, the Fed has been trying their hardest to create a softening in the labor market, and that simply hasn’t emerged quite yet which, generally speaking, is a good thing for investors and the economy as a whole. This is, of course, assuming that inflation remains on its current downward trajectory.
In July, we are looking forward to the next CPI report which will be released on July 12th. The month then concludes with the next FOMC meeting that ends on July 26th. According to some of the data we track at Destiny Capital, headline CPI is projected to fall to between 3.2% and 3.5%. Furthermore, the data suggests that there is a 92% chance that the Fed will implement another 25bps (0.25%) rate hike during the July meeting to reach a target rate between 5.25%-5.50%. Assuming that the inflation numbers come-in as projected, this means that we are finally one step closer to terminal interest rates and the end of the perpetual rate hike cycle. While Fed policy has provided challenges for investors to-date, we see a future with a bit more certainty ahead, and potential opportunities we hope to capitalize on as investors.
Important note and disclosure: This article is intended to be informational in nature; it should not be used as the basis for investment decisions. You should seek the advice of an investment professional who understands your particular situation before making any decisions. Investments are subject to risks, including loss of principal. Past returns are not indicative of future results.
Share this
Stay Ahead with Smart Investments
Learn how to invest wisely and minimize risks to protect your retirement savings.

Achieve Your Retirement Goals
Get personalized advice to meet your retirement goals. Book your call with Destiny Capital now.