Markets and Economy Update – January 2024
The old adage “be fearful when others are greedy, be greedy when others are fearful” is often ascribed to acclaimed investor and Berkshire Hathaway CEO, Warren Buffett. Based on my experience as an investment manager, I generally tend to agree with this statement. To me, this axiom is more about mindset rather than serving as an edict on opportunism. I view it as an understanding that things are never quite as good or as bad as they may seem in the moment, regardless of circumstances. In investing, we often talk about collective emotions like fear and greed in an attempt to generalize overall sentiment. Are investors bullish (positive) about the stock market? Are they bearish (negative)? Is the Fed hawkish and looking to raise rates and constrict the economy? Are they dovish and seeking to implement expansionary policies that may foster economic growth?
In previous letters and webinars, we’ve talked quite a bit about the prevalence and persistence of investor and consumer pessimism since the onset of the COVID-19 pandemic. Given the unprecedented levels of uncertainty brought about by the pandemic, pessimism and fear were clearly understandable at the time. However, as inflation began to rapidly ascend to daunting new heights in the summer of 2022, consumer sentiment subsequently fell to its lowest level (50) since the index was released by the University of Michigan in 1952. While sentiment ultimately rebounded a bit from this historic low, it still remained well-below pre-pandemic levels.
However, thus far in 2024, we’ve actually begun to see a shift towards optimism based on some recent data that has emerged. When it comes to consumers, you can see a recent spike in consumer sentiment in the chart below as the index jumped from 61 on November 30, 2023 to 79 on January 31, 2024.
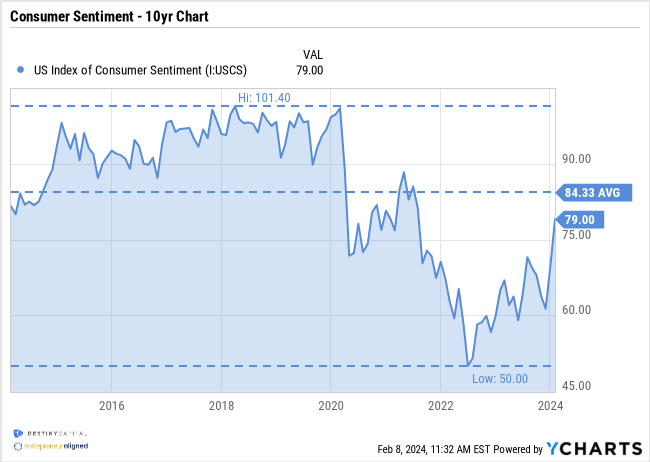
While consumer sentiment remains below pre-pandemic levels, it’s beginning to approach the long-term (72-year) average of 85.
When it comes to tracking investor sentiment, we can look at the AAII Investor Sentiment Survey, which records the percentage of investors who have a bullish, bearish, or neutral outlook on the stock market. As you can see in the chart below, the percentage of bullish (positive) investors began to climb above 50% in late 2023 and, at 49.07%, remains elevated relative to historical averages.

Over the past few years, our team grew a bit surprised at the depth and persistence of consumer pessimism given what we were seeing in the overall economic data. After all, as we intimated earlier, consumer sentiment even fell below the lowest levels reached during the Great Financial Crisis of 2008. That, to me, was rather eye-opening.
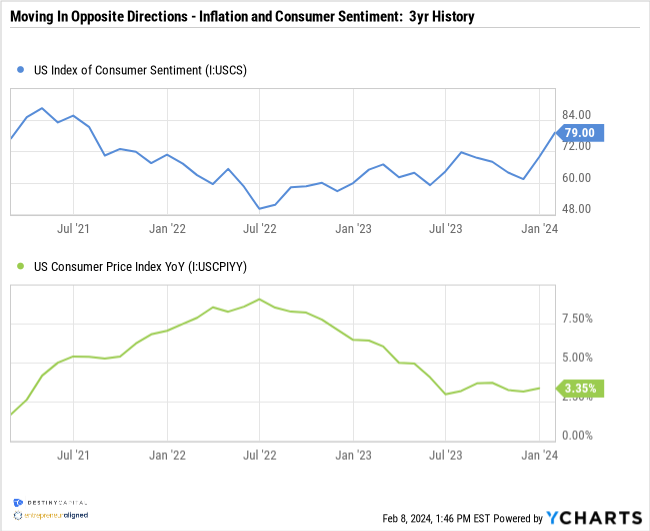
However, in hindsight, it appears as though we were underestimating the burden that inflation was placing on the psyche of the American consumer. Over time, we recognized an inverse relationship between inflation and consumer sentiment, meaning that as inflation continued to rise, consumer sentiment continued to fall. Then, conversely, as inflation began to fall, consumer sentiment slowly began to rise once again. This is illustrated below in the 3-year chart that shows consumer sentiment in blue and inflation (CPI) in green.
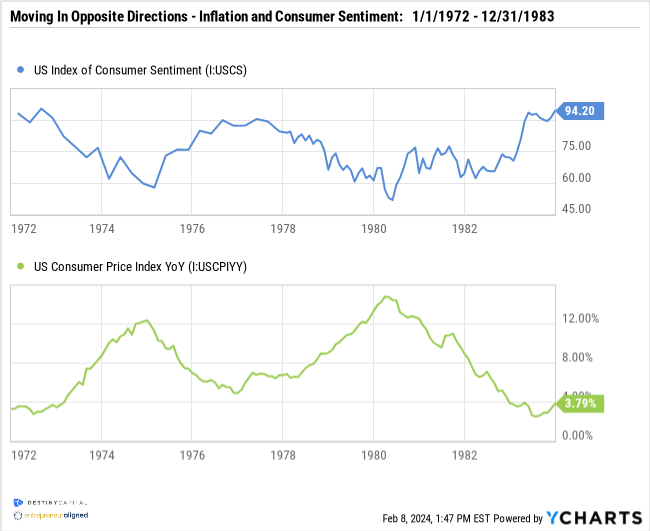
When was the last time such a relationship existed between inflation and consumer sentiment? You guessed it – back in the mid-1970’s and early-1980’s as inflation whipsawed the mindset of consumers for roughly a decade as seen in the chart below. Once again, consumer sentiment is represented in blue and inflation (CPI) in green.
Why does consumer sentiment matter? Well, consumer spending comprises roughly 70% of U.S. Gross Domestic Product (GDP). When consumers are optimistic, they tend to spend more freely. When they spend more freely, business revenues may grow. If revenues grow and a business is well managed, earnings could increase, which tends to be a good thing for shareholders. Those are some very simplistic and broad generalizations, but you get the idea. As goes the consumer, so goes the U.S. economy.
The S&P 500 Hit A New High – Is It Time To Worry?
This finally brings us back to the fear vs. greed dichotomy. With consumer/investor sentiment improving and the stock market hitting new all-time highs, are the scales finally tipping back toward greed? Does this mean that investors need to be fearful? Not quite.
As a native east-coaster, I’ve developed a well-tuned sense of cynicism. Furthermore, as a father of two boys ages three and six, I sometimes have a bit of a ‘this is why we can’t have nice things’ attitude. Hypothetically, this perspective might emerge when a 3-year-old spills a bowl of juicy pomegranate seeds on a brand new carpet or sofa. Note: pomegranates are up there with roasted beets in the ‘most difficult stains to remove’ rankings. Bottom line – when things start moving in a positive direction, I innately start waiting for the other shoe to drop, much like when my Philadelphia Eagles began the 2023 NFL season with 10 wins and 1 loss (hint: they ended the season 11-6).
When it comes to investing, I like to look at the chart below to remind myself that a bull market is nothing to fear. The S&P 500 hits new all-time highs consistently over time. In fact, the S&P 500 index has hit over 1,170 new highs since inception in 1957, as you can see in fine print on the chart below.

On average, this would hypothetically mean that the S&P 500 hits a new high every 14 to 15 days. What’s unusual about today’s stock market is that it took over two full years for the S&P 500 to exceed its previous high of roughly 4800 from early January of 2022.
When it comes to returns thus far in 2024, stocks appear to be in a similar boat to what we saw in 2023 with the top 7-10 companies driving the majority of returns. In fact, as of this final edit on February 8th, both NVIDIA and Meta (Facebook) are already up a staggering +40.6% and +32.7%, respectively.
To this, many of you may be thinking “why doesn’t Destiny Capital just buy these top 7-10 stocks, kick their feet up, and call it a day?” That’s an understandable question given how much praise has been heaped upon these stocks for carrying market returns over the past 12-18 months.
However, focusing solely on 2023 returns doesn’t tell the full story, and discounts the volatility that each of these stocks experienced during the prior year. As a reminder, here are the calendar return for these seven stocks in 2022:
| Tesla | -65.03% |
| Meta | -64.20% |
| NVIDIA | -50.20% |
| Amazon | -49.60% |
| Alphabet | -39.09% |
| Microsoft | -28.02% |
| Apple | -26.40% |
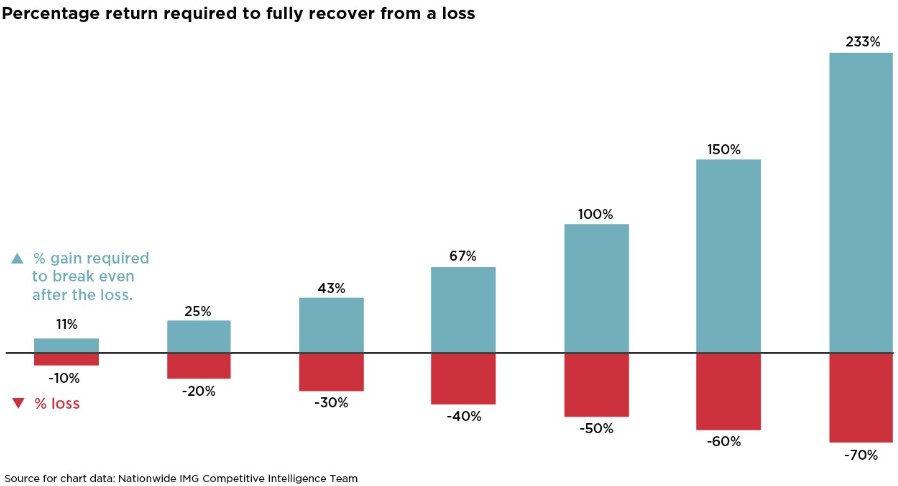
The S&P 500 index fell nearly -25% in 2022, but ended the year down -18.1% which, while painful, is less difficult to recoup than what we see above. Remember, a -50% loss isn’t recovered with a 50% return. A -50% loss requires a +100% return to fully break-even. A -60% loss requires a staggering +150% return to fully recover. This depressing dynamic can be seen in the chart below.
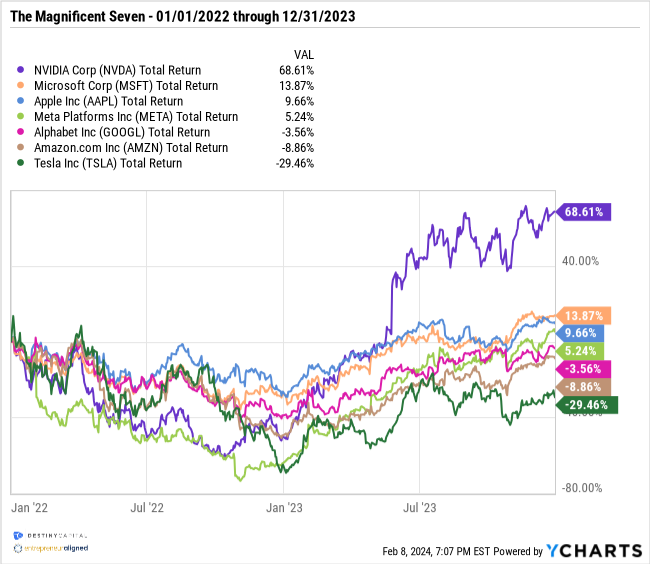
Therefore, it should come as no surprise that three of the seven ‘Magnificent Seven’ stocks have actually had negative returns during the two years span of January 1, 2022 through December 31, 2023, as seen below.
This helps to illustrate why, as investors, we don’t put all of our eggs in one basket, and why we staunchly believe that a diversified investment portfolio is the best way to accumulate and maintain wealth over time. Would we like to see a broader rally take hold across additional asset classes in the weeks and months ahead? Of course we would, and we could potentially see a broader rally materialize, in part, as the Fed begins to unwind their restrictive policies further down the road in 2024.
I, for one, am relieved to begin to see some of the miasma of consumer & investor despondency begin to fade as the burden of inflation continues to wane. I’d much rather be focused on navigating new market highs than wondering if the market has bottomed-out. However, we are well-over halfway through Q4 2023 earnings season, and news is coming-in fast and furious. We’ve seen some disappointments among the high profile stocks (Tesla) while blockbuster results from companies like Meta have sent their stock price soaring. As a result, investor enthusiasm has taken hold, for now, and the S&P 500 has risen close to +4% year-to-date as-of this writing.
We are also closely tracking inflation data to gauge whether or not the Fed will remain on track to lower rates in the months ahead. At this stage, we believe that rate cuts are likely after the Fed’s June meeting, but we could see cuts emerge as early as May if CPI/PCE inflation numbers come in a little better than anticipated. Early rate cuts, we believe, would be viewed positively by investors.
In the meantime, we are rapidly approaching tax season or, if you are among our CPA friends, you’re already buried neck deep. Most investors should be receiving 1099’s from Fidelity in the days and weeks ahead according to the schedule included below. As always, please reach out to our team for any portfolio and/or tax-related questions or to discuss planning initiatives for 2024.
Fidelity Tax Document Release Schedule – 2023 Tax Year
| Form name | Available online | Sent by mail |
| 1099 (Group 1) | January 20 | January 26 |
| 1099 (Group 2) | February 10 | February 16 |
| 1099 (Group 3) | February 24 | March 1 |
| 1099 (Group 4) | March 6 | March 12 |
| 1099-R | January 20 | January 26 |
| 5498 | January 19 | January 25 |
| 1099-Q | January 12 | January 18 |
Important note and disclosure: This article is intended to be informational in nature; it should not be used as the basis for investment decisions. You should seek the advice of an investment professional who understands your particular situation before making any decisions. Investments are subject to risks, including loss of principal. Past returns are not indicative of future results. Advisory services provided by Destiny Capital Corporation, a registered investment adviser.
Share this
Stay Ahead with Smart Investments
Learn how to invest wisely and minimize risks to protect your retirement savings.

Achieve Your Retirement Goals
Get personalized advice to meet your retirement goals. Book your call with Destiny Capital now.