Markets and Economy Update – Hurry Up and Wait
With my eldest son in his first year in the public school system, my wife and I have had to quickly become accustomed to the concept of ‘spring break’ travel. Historically, I’ve tried to avoid vacationing during peak-season time frames due to higher prices, larger crowds, and all that. Lamentably, for the next decade, it looks like we’ll be arranging some kind of travel plans around late March, early April along with every other family with school-age kids in the United States. Alas, in early April, my wife, two boys and I ended up traveling south of the border for what turned out to be a wonderful few nights of pools, playa, and plenty of food.
However, some minor complications emerged during the journey home to the U.S. I’ll be brief, I promise. Essentially, our airport transfer service insisted on a 1pm pickup for a 6pm flight. This schedule sounded conservative, to say the least, but you never know what to expect with international travel, so we shrugged our shoulders and abided by their guidance. Naturally, we arrived at the airport ahead of schedule, breezed through all pre-flight logistics in exactly 24 seconds and found ourselves with about 4 ½ hours to kill at the airport with our three and six-year-old boys. There are only so many Margaritaville margaritas that can get you through such trying times. Then, after the hours whittled away, everyone eventually lined up to board the flight only for the gate attendant to grab the intercom and tell us of one thirty minute delay, then another as we lined up to board once again. The wait seemed interminable.
Like bone-weary travelers with a 3-year-old, investors have been not-so-patiently waiting for Federal Reserve rate cuts for many, many months. In fact, heading into 2024, futures markets were predicting six to seven 0.25% rate cuts throughout the year (I should note that we found those projections to be absurdly optimistic). As we all know, markets are forward-looking. So, in late 2023, investors – particularly in bond markets – began to price-in these aggressive rate cuts, setting themselves up for disappointment if there was any deviation from these overly-optimistic assumptions. As you might expect based on what’s happened over the past few years, Fed policy has likely shifted as economic realities evolved in 2024. Instead of imminent rate cuts, investors are now talking about delays. So, in this month’s letter, we’ll review why there has been a shift in interest rate assumptions for this year, and what that might mean for investors.
It was the best of times, it was the worst of times
When I was reviewing the economic data for this months’ letter, I couldn’t help but think of the first few lines of A Tale of Two Cities where Charles Dickens writes, “It was the best of times, it was the worst of times.” In many ways, the U.S. economy is as strong and resilient as I can remember, yet, there are elements that mute the pervasiveness of optimism. When it comes to some of the positives, we consider some of the data points below.
US Non-Farm Payrolls Added (March): 303,000 vs. 200,000 expected – 39 consecutive months of positive jobs growth.
Unemployment Rate: 3.8% – over two full years with the unemployment rate below 4%.
S&P 500, Dow, & Nasdaq: All recently at all-time highs
Home Prices: All time highs
US Gross Domestic Product (GDP): 4.9% in Q3 and 3.4% in Q4 of 2023. Q1 2024 estimate is 2.4%.
ISM Services & Manufacturing PMI: 51.4 & 50.3 respectively – 50+ is considered expansionary (good).
Earnings Growth: the Q1 2024 earnings growth rate for the S&P 500 is estimated to be between 3%-6%, this would represent the 3rd consecutive quarter of positive earnings growth.
Low Market Volatility: Year-To-Date Max Drawdown in the S&P 500 is -2.2%.
When it comes to the not-so-good data, we really have to look no further than the recent Consumer Price Index (CPI) inflation report. Like any endurance event, the last few miles are always the hardest, and we’re seeing progress on inflation stall a bit, particularly when looking at the both headline and core CPI as seen in the chart below.
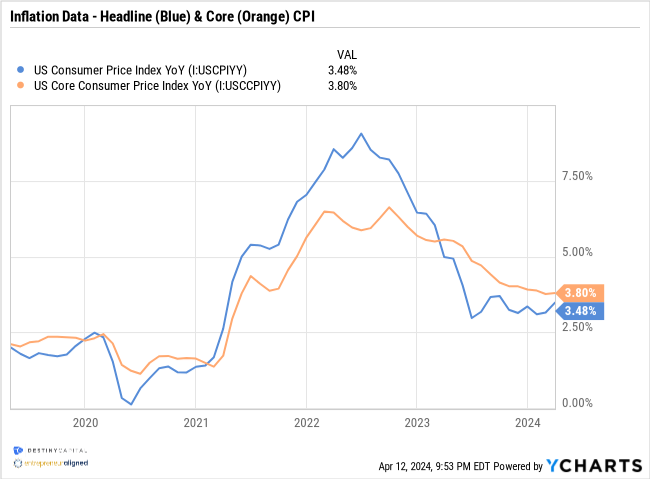
Headline and core CPI are both heavily dependent on shelter (housing) prices. For example, the shelter index (housing) makes up 33% of headline CPI, and a staggering 42% of core CPI. So, until there is additional progress on shelter costs in the U.S., it is going to be challenging to chip-away at CPI inflation for it to reach that 2% target.
Beyond the raw numbers, elevated inflation has undoubtedly had an impact on the psyche of consumers. While sentiment has improved since bottoming-out in 2022, it’s still difficult for consumers to feel like they are ‘getting ahead’ after several years of above-average price increases. No, prices aren’t increasing 9% year-over-year like they did during the summer of 2022, but they are still increasing at a pace well-above the 2% Fed target.
At times, there also seems to be a disconnect between what the CPI/PCE inflation data reports and what consumers feel in their wallets. As a purely subjective and situational example, I’ve been reading reports of declines in the cost of airfare which is reflected in the public transportation index component of CPI. This summer, my wife and I were hoping to travel back to Colorado with our two boys so we could visit some of our favorite Rocky Mountains haunts. After all, there are few better places on earth than summertime in Summit & Grand counties.
However, I was dismayed to find that non-stop, non-redeye airfare totals for a family of four ranged from $2,600 to $3,200 from Newark International to Denver International despite flexible travel dates & times. I’ve made this exact round trip dozens upon dozens of times over the past two decades and, prior to the COVID-19 pandemic, this exact roundtrip flight would’ve ranged between $1,400 to $1,800 for 4 travelers. As someone who’s earned the Certified Financial Planner (CFP) designation, it’s hard to silence the little voice in my head that asks if I can justify spending $800 per person for a 4 hour flight. To me, it’s a question of value for cost. I’m often left wondering whether or not my experience with airfares is simply my personal perception or a reality felt by many others?
It’s becoming apparent that others have been feeling a similar sentiment, as the Wall Street Journal recently released an article titled “How Far $100 Goes at the Grocery Store After Five Years of Inflation”. In the article, they took a basket of common grocery store items (milk, eggs, detergent, chicken, veggies, fruit, etc) that totaled roughly $100 in 2019.
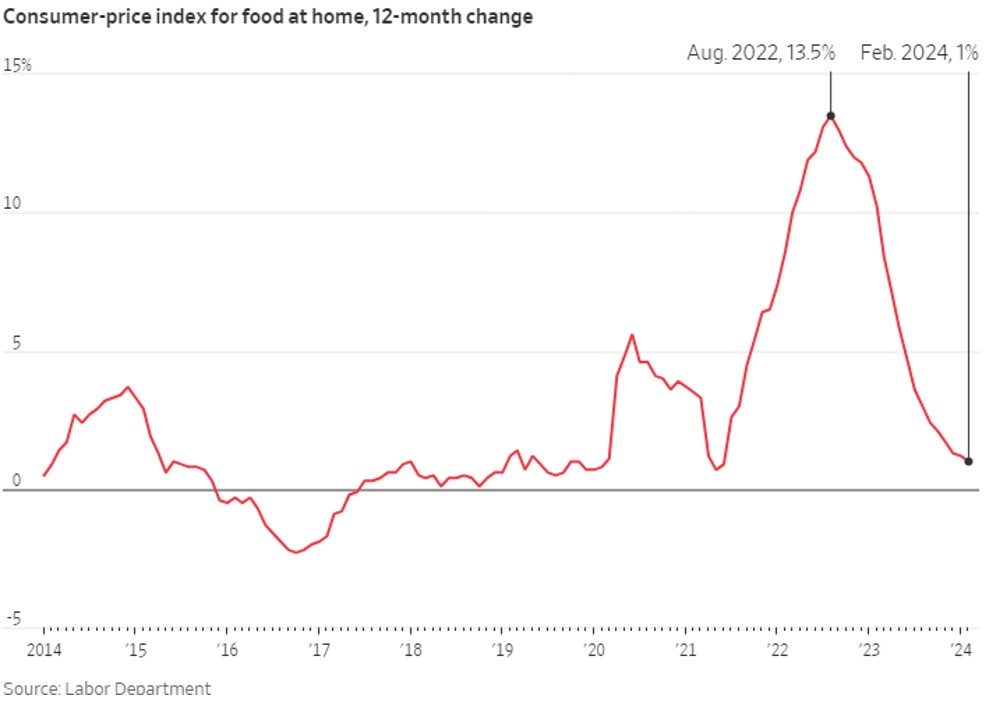
To summarize the article, what cost $100 in 2019 now costs nearly $137 today – a roughly 37% increase (#math) in five short years. Apparently there’s a reason there are so many social media posts with pictures proclaiming “so this is what $100 gets you at the grocery store today?!” with a few scant items strewn across a kitchen counter. Yet, according to CPI reports, food at home prices are only rising 1% year-over-year, as you can see in the chart below. So, how can prices still feel so elevated relative to what we’re all ‘used to’?
Well, the chart below may help to illustrate where we are vs. where we could’ve been had inflation not reared its ugly head back in 2021. Had inflation maintained close to a 2% year-over-year trajectory, we might’ve seen a trend line similar to what is represented by the red line below. In this hypothetical scenario, perhaps the CPI index ends up somewhere in the 282 range. Instead, prices increased so rapidly between 2021 and 2023 that we now have the CPI index over 312.
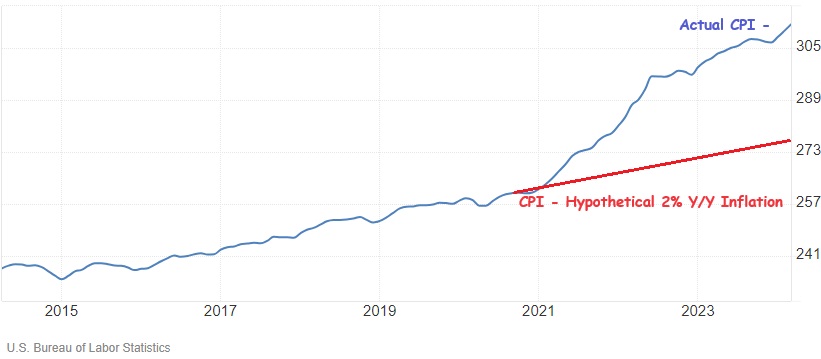
As we all know, a 5% price increase on a $3,000 rent payment hits the wallet a bit differently than a 5% increase on a $1,500 rent payment. This is why the Federal Reserve takes the inflation problem so seriously. So, yes, we are seeing the pace of year-over-year inflation decline (disinflation) over time, but we’d actually need to see negative price growth on a year-over-year basis (deflation) to get back to that hypothetical red trend line from 2021. Unfortunately, it appears as though prices have permanently upleveled and we can only hope to effectively manage the new trend line from here on out. I suppose the days of a $350 round trip flight from Newark to Denver are over.
What does this mean for investors?
As I alluded to at the beginning of this letter, recent inflation data likely means that investors are going to experience delays when it comes to the onset of interest rate cuts. As stated earlier, at the end of 2023, investors were anticipating between six and seven 0.25% interest rate cuts during the 2024 calendar year.
Here we are just a few short months later and, according to futures markets, investors are now pricing-in one, maybe two 0.25% interest rate cuts this year, with the first likely to occur after the September Federal Open Market Committee (FOMC) meeting.
Much of this shift in sentiment is very new with these updated assumptions emerging after the April 10th CPI report. Prior to this latest CPI report, investors were certain that the first rate cut in 2024 was coming in June. In fact, immediately after the March 20th Fed meeting, investors were so optimistic about this that they were pricing-in a 70.5% probability of a rate cut during the Fed meeting in June, according to the CME Group’s FedWatch tool. The FedWatch tool analyzes real-time fed fund futures contract data to assign investor probabilities to certain interest rate outcomes.
Yet, less than a month after the March 20th Fed meeting, investors are just as certain (71.7% probability) that no rate cut will emerge in June based on updated data from the CME Group’s Fedwatch tool.
Is this an overreaction to a single inflation report? Probably. Remember, the Fed’s preferred measure of inflation is PCE, not CPI, and PCE at 2.5% headline, 2.8% core is much closer to the Fed’s 2% than CPI.
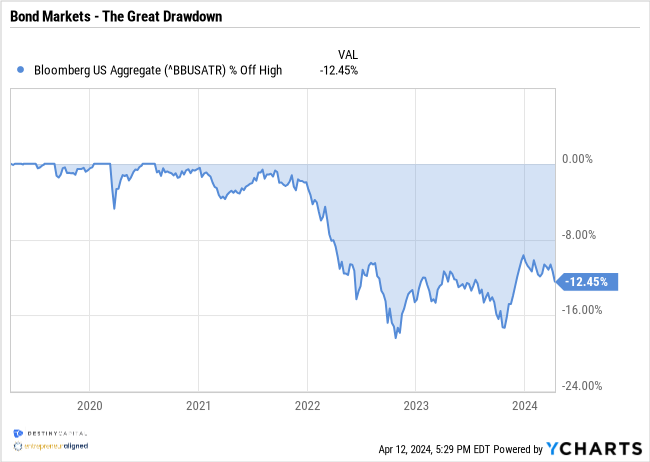
When considering investor portfolios, the anticipated delays in rate cuts are continued bad news for bond markets, which simply can’t get over the hump. In fact, bond markets (as measured by the Bloomberg US Aggregate Bond Index) have been mired in their longest and steepest slump in history. This can be seen in the drawdown chart below that shows the percent decline in the bond market since its most recent peak in early August of 2020.
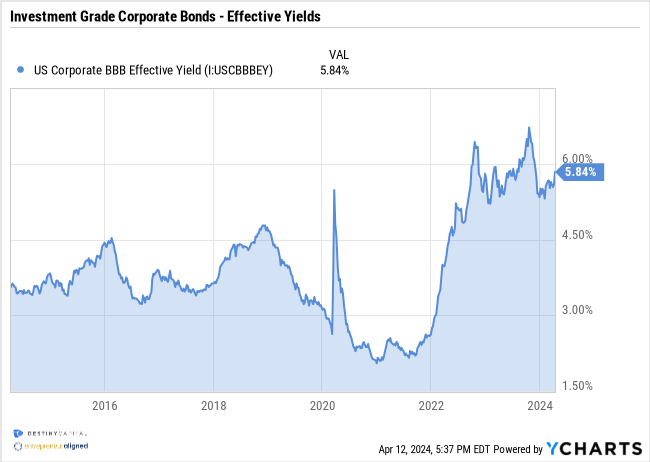
However, at this stage, much of the interest rate risk inherent in bond investments is already baked into the pie, as they say. Bond investors can at least take solace in the fact that they are being compensated for their investment. This can be seen in the chart below that shows BBB-rated investment grade bonds yielding a strong 5.84%.
When it comes to stocks, it’s important to note that the S&P 500 has experienced very little volatility thus far in 2024. In fact, the largest drawdown (peak-to-trough decline) in the S&P 500 in 2024 has been -2.2%. Over the past 40+ years, the S&P 500 index has averaged an intra-year drawdown of -14.2%. This means that, at some point each year, you can expect the S&P 500 index to decline -14.2% before – historically, at least – eventually rebounding.
We also measure volatility using the CBOE S&P 500 Volatility Index (aka ‘the VIX’). Generally speaking, we consider any VIX reading over 20 to be ‘volatile’ and, thus far in 2024, volatility has been muted with a year-to-date VIX average of 13.9. As a baseline, since the year 2000, VIX has averaged 19.98.
The point I am trying to make is that we should expect market volatility in the months ahead. This volatility may not be triggered by some catastrophic market event, but because the way markets have been acting and reacting to this point in 2024 is the exception, not the rule. In fact, the last time the CBOE S&P 500 Volatility Index exceeded 20 was back in late October of 2023. Volatility is normal, and markets have been eerily calm over the last five-and-a-half months.
We are also at the beginning of an important earnings season. Q1 ‘24 earnings kick-off with many of the big players in the Financials sector (BOA, Citigroup, Goldman Sachs, JP Morgan, Morgan Stanley & Wells Fargo) reporting earnings which could, for good or ill, help set the tone for this season. The sectors expected to see the largest earnings growth include Information Technology, Communication Services, Consumer Discretionary and Utilities. Clearly, the largest companies in these sectors have been among the most significant contributors to stock market returns over the past 12-18 months, so we’ll be keeping a close eye on these sectors.
Furthermore, immediately before this letter’s publication, we learned about the drone/missile attack launched on Israel by Iran. When the war between Israel and Hamas began back in October of 2023, investors (and citizens) grew concerned about the threat of contagion given existing tensions in the region. As such, we will be watching developments closely this week to see if Iran’s aggression will further escalate an already fraught conflict.
For investors, it is difficult to predict how markets will react, but some long-overdue volatility could emerge if Israel’s response continues to ratchet up regional pressures. While many may assume that the stock market will sell-off in the short-term due to Iran’s aggression and a potential response by Israel, I would caution against making any such predictions. An escalating conflict in the middle east could create additional risks to the U.S. economy and – in a potentially odd twist – the Fed may seek to cut interest rates in order to avoid stalling growth, and this news could be well-received by markets. Clearly, these are all hypotheticals at this point and it’s always difficult to speak about money and investments when talking about war. All news emerging out of Israel and the middle east is very new, and we will keep you apprised of any developments that may impact investor portfolios in the days and weeks ahead. At this stage, I would just caution against any emotional, reactionary decisions during times like these. Of course, if you have any immediate questions or concerns, our team is here to listen, understand, and offer guidance, so please don’t hesitate to reach out.
Important note and disclosure: This article is intended to be informational in nature; it should not be used as the basis for investment decisions. You should seek the advice of an investment professional who understands your particular situation before making any decisions. Investments are subject to risks, including loss of principal. Past returns are not indicative of future results. Advisory services provided by Destiny Capital Corporation, a registered investment adviser.
2024 YCharts, Inc. All Rights Reserved. YCharts, Inc. (“YCharts’) is not registered with the U.S. Securities and Exchange Commission (or with the securities regulatory authority or body of any state or any other jurisdiction) as an investment adviser, broker-dealer or in any other capacity, and does not purport to provide investment advice or make investment recommendations. This report has been generated using data manually input by the creator of this report combined with data and calculations from YCharts.com and is intended solely to assist you or your investment or other adviser(s) in conducting investment research. You should not construe this report as an offer to buy or sell, as a solicitation of an offer to buy or see, or as a recommendation to buy, sell, hold or trade, any security or other financial instrument. THE IMPORTANT DISCLOSURES FOUND AT THE END OF THIS REPORT (WHICH INCLUDE DEFINITIONS OF CERTAIN TERMS USED IN THIS REPORT) ARE AN INTEGRAL PART OF THIS REPORT AND MUST BE READ IN CONJUNCTION WITH YOUR REVIEW OF THIS REPORT. Disclosure – YCharts
Share this
Stay Ahead with Smart Investments
Learn how to invest wisely and minimize risks to protect your retirement savings.

Achieve Your Retirement Goals
Get personalized advice to meet your retirement goals. Book your call with Destiny Capital now.