Markets and Economy Update – December 2022
To be honest, I have never been a big New Year’s Eve kind of guy. When I was in my early-to-mid twenties, sure, I enjoyed a good New Year’s Eve party here and there. These days, however, I am the guy who watches the packed crowds in Times Square on television and says, “Pfft, good luck finding a bathroom in that mess,” as my wife shakes her head and sighs.
Still, I do think the year’s end represents a decent time to reflect back on the year that passed, including goals achieved, goals missed, lessons learned and so forth. When I think back on 2022 and each year going back to the 2020 COVID-19 pandemic, one word consistently emerges in my mind. “Change”. Change is always going to be constant. Just ask Bob Dylan, who wrote and sang all about it back in 1964. However, it seems that the size, scale and rapid pace of change in recent years has had an unsettling effect on many lives.
These changes have been foundational, with the pandemic impacting our health, how we gather with family and friends, how we work, where we live, how we eat, how we cope and much more. Also, geopolitical conflict like the war between Russia and Ukraine not only causes tragic hardship for those directly involved, but creates a tremendous uncertainty around potential escalation across the globe.
Over the last 42 years, the S&P 500 has experienced an average intra-year decline of -14%. Over the past five years, the S&P 500 has experienced intra-year declines of -20% or more in THREE of those five years, as seen in the chart below.
Source: JP Morgan Asset Management
The deep and rapid swings in financial markets experienced over the past five years can also be quite unnerving, causing elevated stress around personal financial stability.
In fact, at this time last year, I do not think too many financial professionals or analysts envisioned the 2022 calendar year returns detailed below for some of the most high profile stocks in the United States.
Source: YCharts, Destiny Capital
As investment managers and investors, we have had to cope with profound changes from those we trust to provide crucial economic guidance, namely the Federal Reserve. This time last year, after the Fed’s December 2021 meeting, the Federal Open Market Committee’s Dot Plot projected a 2022 year-end Fed funds target rate of roughly 0.75% – 1.00%, as highlighted in the red box below.
Source: Federal Reserve
Those projections indicated that investors should expect a patient and deliberate pace of rate normalization with a few 25 basis point rate hikes throughout the year. Instead, due to unforeseen and persistent levels of inflation, rate normalization was injected with rocket fuel. The federal funds rate soared meeting after meeting.
Instead of reaching the projected .75% to 1.00% level, the federal funds target rate ended the year at 4.25% to 4.50%, a full 300 basis points (3.00%) above 2021 estimates. The chart below illustrates the unprecedented and rapid ascent of the upper (orange) and lower (purple) limits of the federal funds target rate throughout 2022.
Fed Funds Target Rate – Upper (Orange) and Lower (Purple) Limits – 2022
We now enter 2023, with the federal funds rate higher than it has been since the Great Financial Crisis of 2008. The question now becomes, as always, “Where do we go from here?”
As we experienced throughout 2022, it will be difficult for financial markets to recover and operate with any level of uncertainty until the Fed eases (or at least pauses) its ultra-restrictive policies. When looking at the year ahead, we can see that investors and the Federal Open Market Committee (FOMC) have differing opinions about where interest rates should land at year-end 2023. This is illustrated in the red box below where the FOMC anticipates the federal funds rate to end the 2023 calendar year at roughly 5.10% (dark blue diamond), while investors see rates at only 4.59% (green diamond).
Source: JP Morgan Asset Management
What is clear at this stage is that rates will likely go higher from here. Over and over, the Fed has used the phrase “sufficiently restrictive” to indicate how high interest rates must rise. Furthermore, in the December 2022 FOMC Meeting Minutes, it was reported, “Participants generally observed that maintaining a restrictive policy stance for a sustained period until inflation is clearly on a path toward two percent is appropriate from a risk-management perspective.”
This means that we should expect to hear the phrase “higher for longer” more and more in the coming weeks, as the Fed has indicated that they would like to raise interest rates to a sufficiently restrictive level and then hold them there for as long as it takes.
As a firm, we are conducting our annual deep dive into Capital Market Assumption (CMA) data, where we seek to identify near-term and long-term trends while analyzing the risk, return and correlation dynamics of asset classes across the investable universe. Given the outlook for monetary policy, the challenge for investors is balancing potential short-term challenges with long-term opportunity, because the data indicates that there will be opportunities for investors in the months and years ahead as detailed in brief below.
Cash is an asset class again
This time last year, it was nearly impossible for an investor to generate yield with cash or cash equivalents of any kind, whether it be through money markets, savings accounts or even CD’s. Year after year, we have seen cash and cash equivalents pay virtually nothing, which can be frustrating for those who maintain a long-term cash reserve for emergency spending or for other planning purposes. However, as rates have risen over the past year, those dynamics have changed, and we are seeing enhanced cash and cash-equivalent investments yielding anywhere from 3.5% to over 4.25% in recent weeks. Additionally, through our partnership with Fidelity, our investors also have access to newly issued and/or secondary market CDs yielding 4.5% or more. These changing dynamics have made cash equivalents an asset class again instead of a perpetual portfolio drag during rising markets.
Fixed income
Moving into 2023, for fixed income investors, effective bond yields have risen to levels not seen in over a decade. This is illustrated in the chart below that shows prevailing yields for corporate bonds of differing credit qualities from AAA (highest credit rating possible), to BBB (investment grade) to BB (high yield).
Effective Yields – AAA, BBB and BB Rated Corporate Bonds
Yes, there may be some near-term interest rate fluctuations to navigate, but bond investments are becoming more appealing given the levels of income that a portfolio can generate relative to any time over the past 10+ years. Beyond that, we believe that it is unlikely that the Fed will maintain sufficiently restrictive rate levels in perpetuity. As such, if rates were to fall in the quarters ahead, the prices of bond investments could climb and provide future tailwinds for fixed income investors.
Equities
Finally, when looking at equities, our CMA review indicates that the outlook for equities asset classes across the board is as strong as it has been in over a decade. This is illustrated in the chart below that compares the 2022 (yellow bar) long-term estimates versus the 2023 (blue bar) long-term estimates for domestic and global equities.
2022 vs. 2023 Long Term Forecasts (Risk Data Not Included)
Source: JP Morgan Asset Management
In fact, based on internal ranking systems, the data suggests that eight of the top ten asset classes (as measured by risk/return dynamics) can be found in equities when compared to ALL other asset classes from fixed income to alternatives.
Again, it is important to note that capital market assumption data is intended to provide investment managers with a framework from which to make long-term allocation decisions. As we all know, market returns are far from linear, and we would expect some additional volatility as we navigate continued change in the weeks and months ahead.
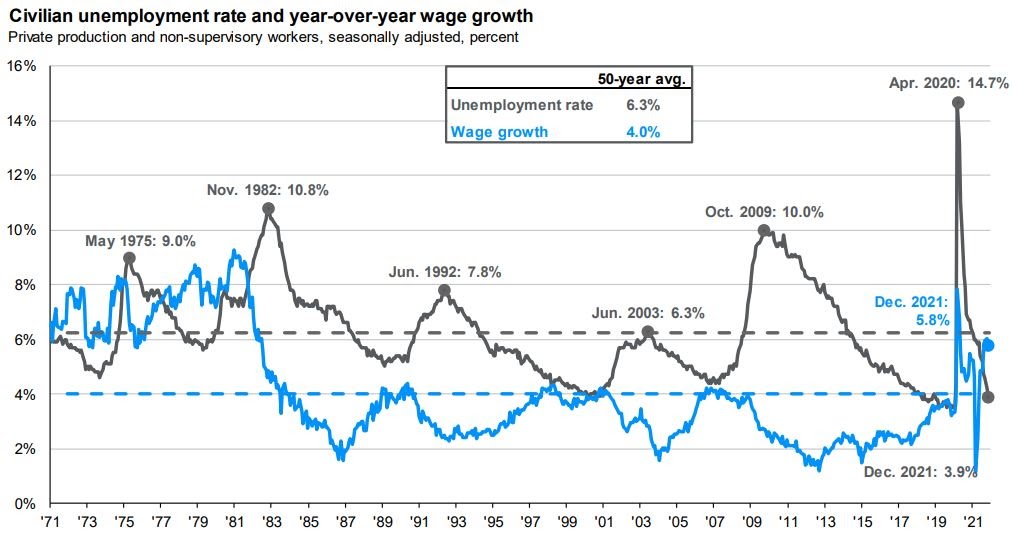
In the near term, our focus shifts to the January 12th Consumer Price Index (CPI) report that, we hope, continues to support a downward trend for headline and core inflation. We will also keep an eye on all relevant economic data such as jobs and any Purchasing Managers Index (PMI) data that could indicate a softening in the labor market and/or a softening in the manufacturing and services sectors. “Progress” (i.e. higher unemployment and PMIs below 50) could indicate that Fed policies are having the desired yet unfortunate effect of contracting the United States economy. These developments would, ironically, be seen as a positive by investors, at least in the short-term.
January then closes with the next Federal Open Market Committee meeting on January 31st through February 1st. This meeting could give us a sense as to whether or not we will have a more predictable path for monetary policy in 2023 or if change will continue at the pace we’ve grown accustomed to in recent years.
Important note and disclosure: This article is intended to be informational in nature; it should not be used as the basis for investment decisions. You should seek the advice of an investment professional who understands your particular situation before making any decisions. Investments are subject to risks, including loss of principal. Past returns are not indicative of future results.
Share this
Stay Ahead with Smart Investments
Learn how to invest wisely and minimize risks to protect your retirement savings.

Achieve Your Retirement Goals
Get personalized advice to meet your retirement goals. Book your call with Destiny Capital now.