Markets and Economy Update – August 2022
As the father of two young boys under five, I have had two distinctly different experiences in raising each child as they developed from infant to toddler. Our oldest child, bless his heart, has always been exceedingly amenable. He is a sweet kid with a warm heart. His first instinct has always been to smile and say, “Yes, Dada yes, Mama,” and finish each interaction with a soft, warm embrace.
The experience with our second child has been, well, quite a bit different. Our second boy is hard-willed. He can be impatient. He can be opinionated. He often is a bit of a wiseass, even at the ripe, young age of (almost) two. He can be quite annoying, in an endearing kind of way. With each of these traits, the boy reminds his mother distinctly of his father, a fact of which I am often made aware.
My wife and I have sometimes pondered how we managed to parent two children with such disparate personality traits. Fundamentally, we are the same parents we have been all along. How could our kids grow to be so different?
When it comes to investing, I think we have all come to learn that, like children, not all market cycles are created equally, and each has their own distinct traits – both good and bad. Over the past nine months, it has become fully apparent that the contractionary period of this market cycle, often like my two year old, has been painfully obstinate. As a result, financial markets have been prone to a tantrum or two.
When raising children, many friends, family and well-wishers often talk about phases. The baby wakes up every 22 minutes from 11:00 p.m. to 4:00 a.m.? Don’t worry, it is just a phase. The toddler vehemently insists on eating everything including soup with his fingers? That is a phase, too. The two year old drops to the ground, red-faced and wailing, at precisely the moment you enter a crowded pedestrian mall? You guessed it! Another phase.
As investors, are we nearing the end of an economic phase defined and dictated by stubborn inflation and market tantrums in the United States? A lot has happened since our last update, so we will first delve into what is happening with inflation and whether or not the United States may eventually move into a more pleasant phase of the market cycle.
Inflation
Many of you may have heard a strange whooshing sound around 8:31 a.m. eastern time back on Wednesday, August 10th. That sound was a collective sigh of relief from millions of investors as the July CPI numberswere released with Headline CPI at 8.5% and Core CPI at 5.9%. Both Headline and Core CPI figures were better than expected than the consensus estimates of 8.7% and 6.1%, respectively. This was some of the first good news that investors received in just over eight months, and markets reacted with measured and ultimately short-lived relief.
Did the July CPI and PCE reports signal the beginning of the end of elevated inflation? It is far too early to tell but, generally speaking, we have seen some positive signs. Since the July inflation numbers were released in August, we have seen further indications in many cases that prices may be continuing to fall.
We will start with crude oil, which began August around $95 per barrel and ended the month at roughly $87 per barrel. Clearly, oil has been range-bound between $95 and $85 depending on the news of the day. We haven’t seen the $110+ price levels tested for quite some time, as seen in the YTD crude oil price chart below.
Crude Oil – YTD Price Chart
Source: NASDAQ
Lower oil prices, in turn, have helped to drive down prices at the pump, with an average price of a gallon of regular unleaded gasoline falling nearly $0.37 cents from August 1st through August 31st, according to data from the U.S. Energy Information Administration.
In the July CPI report (released August 10th), we were somewhat alarmed when we saw prices peak for food items nearly across the board, including key family staples like milk, eggs, bread, chicken and ground beef, as seen in the chart below from the Bureau of Labor Statistics.
Source: Bureau of Labor Statistics
Since July, we are seeing some indications that prices may be falling from July levels, as indicated in some of the price data below for staples like milk and eggs.
Eggs – Price Per Dozen
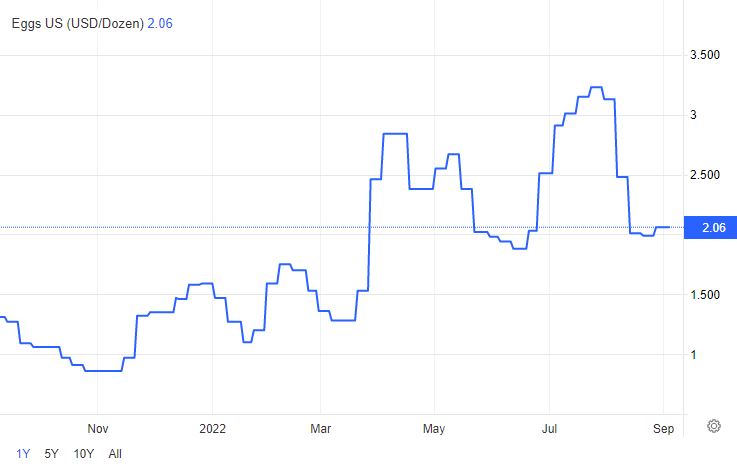
Source: Trading Economics
Milk – Price Per Hundredweight
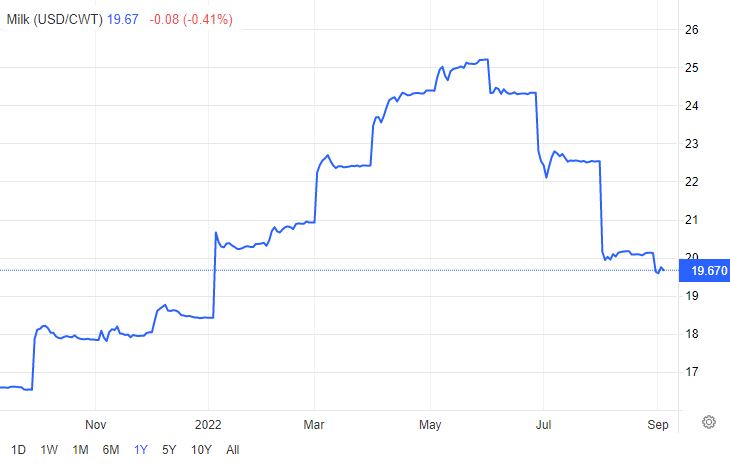
Source: Trading Economics
While some of this aggregate data may be moving in the right direction, there are still some areas of concern. One crucial price point is natural gas, which spiked once again through July and into early August of 2022, when prices peaked around $9.68 per MMBtu in mid-August and remained elevated throughout the remainder of the month.
What caused this spike in natural gas prices? It has been a while since we have discussed the economic effects of the Russian invasion of Ukraine, since oil prices have retreated from their highs of early June. Therefore, our next topic brings Russia back into focus due to recent developments and their effects, not only on inflation, but on the European and global economy.
Russia’s next target – European natural gas?
As is typical this year, I nearly complete this monthly letter only to have some last-minute revelation occur prior to distribution that requires some kind of addition or revision. In this case, on August 31sth, Russia’s state-owned natural gas producer, Gazprom, announced that it had halted gas supplies to Germany via the Nord Stream 1 pipeline, citing “maintenance” issues.
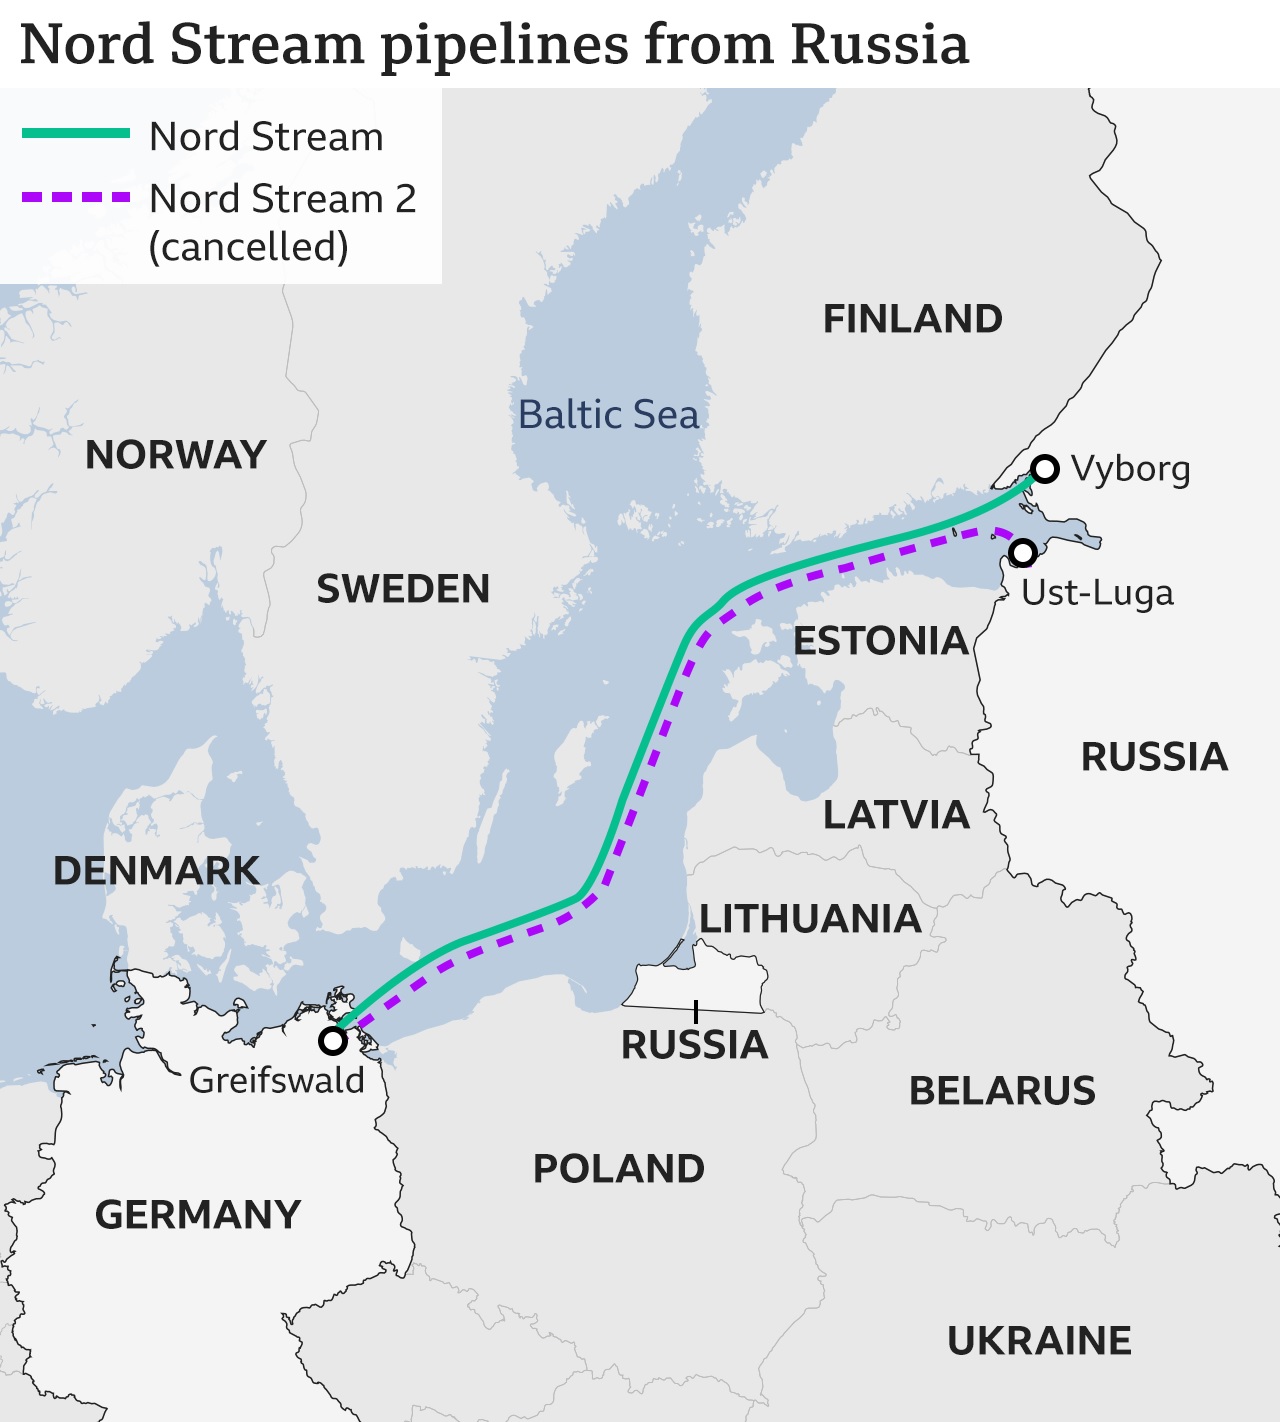
These maintenance issues were clearly met with skepticism, as many global pundits wonder whether or not Russia has finally decided to use its largest source of leverage over the west in ceasing support for Ukraine by permanently cutting off exports of natural gas to Europe.
The announcement of the pipeline shutdown sent European natural gas prices skyrocketing, and it raised fears that there may not be enough energy resources to support Europe through a long and cold winter. If we look at the Rystad Energy chart below, we see a trend in Europe where the diversification of power generation is reducing significantly, particularly from key sources like nuclear energy, as countries like Germany continue to decommission nuclear power plants. Droughts have also reduced the effectiveness of hydro power, leaving gas and coal as the top energy sources in Europe’s monthly power generation mix, just behind nuclear.
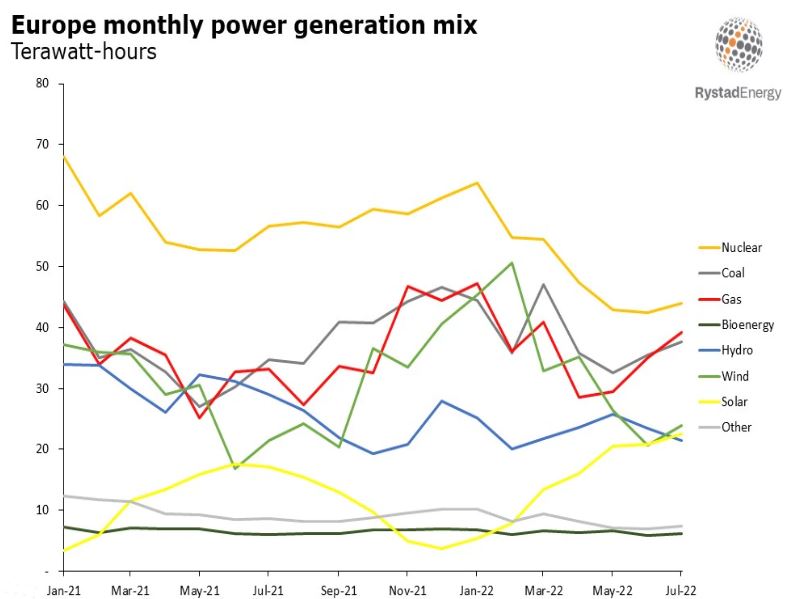
Source: Rystad Energy
While alarming, it is also important to note that Russia has played this game before. In May, Gazprom shut down a different pipeline that delivered gas to Germany and other European nations and runs through Belarus and Poland. In early July, Russia shut down the Nord Stream 1 pipeline for 10 days, citing “maintenance issues” at the time. Sound familiar?
While global oil and gas markets can be exceedingly complex, we will use the chart below that tends to be specific for the North American natural gas market (Henry Hub). As you can see below, natural gas prices have been quite volatile throughout 2022. They even reached new YTD highs in August, as supply was moderate and demand high, with much of the country battling heatwaves.
Natural Gas Chart – YTD Prices
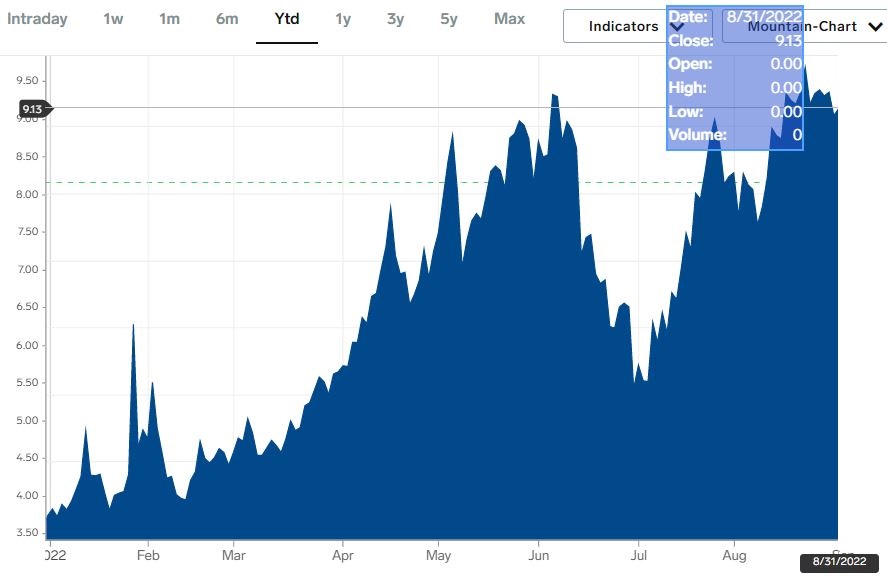
Source: Market Insider – Natural Gas Price Chart
Natural gas prices could impact investors in two key ways. First, natural gas prices could impact inflation by keeping headline CPI and PCE slightly higher than it might be otherwise, thus potentially keeping the Fed on its hawkish path even longer. Second, Europe could be in for a real struggle if the Nord Stream 1 pipeline is shut down indefinitely, or even for an extended period of time. If the pipeline is shut down indefinitely, it is hard to imagine a scenario where Europe avoids a recession.
Event-driven outcomes like the pipeline shutdown are exceedingly difficult to predict. Is this latest Nord Stream 1 maneuver simply Putin’s way of jabbing Europe in the ribs and saying, “Remember, I can make things very painful for you,” or is this an even more aggressive escalation? We will likely find out in the coming days and weeks.
In the meantime, all of the inflation data outlined in this letter ultimately boils down to one thing – monetary policy and its impact on financial markets. So, we will switch focus back to the Federal Reserve to close out this month’s letter.
The Fed (a rudderless month)
As described earlier in this letter, economists and investors finally received some good news on August 10th, when CPI came-in better than expected. However, August CPI and PCE reports provided little in the way of guidance related to Fed policy. After all, there was no official FOMC meeting in August or a determination related to interest rates, so all investors can do is wait and wonder. This is a stance I have grown impatiently accustomed to throughout 2022 as crucial economic data is revealed at a snail’s pace.
We then once again heard from Fed Chairman Jerome Powell in his speech on August 26th. In his speech, Powell stated, “July’s increase in the target range was the second 75 basis point increase in as many meetings, and I said then that another unusually large increase could be appropriate at our next meeting. We are now about halfway through the intermeeting period. Our decision at the September meeting will depend on the totality of the incoming data and the evolving outlook. At some point, as the stance of monetary policy tightens further, it likely will become appropriate to slow the pace of increases. Restoring price stability will likely require maintaining a restrictive policy stance for some time.”
Markets clearly didn’t like what they heard from Powell, as all major indices declined significantly in the following days. To this market response, my question has always been, “What the heck were investors expecting to hear from Powell?” Was he going to say, “We got one decent CPI & PCE report. Mission accomplished! Let’s reduce the fed funds target rate 100 basis points and let the good times roll!” Powell’s speech communicated exactly what it should have with a message of, “We have made progress, but there is more work to be done.”
Clearly, markets have been reactionary to any hint of good or bad news. This reactionary environment is even more pronounced during a “rudderless month” where we got no firm Fed policy guidance outside of a rather boilerplate speech by Jerome Powell.
In fact, it has been one of the most confusing and counterintuitive periods of time in my career. For example, 528,000 jobs were created in July. That is good, right? No, it is not. A strong and growing labor market will make the Fed believe that they can tighten the economic leash even further. Manufacturing and Services PMI numbers are falling ever closer to contractionary ranges (50 and below). That is bad, right? No, that is good. The Fed wants to see a slowing economy in order to ease their restrictive policies. GDP is negative for two consecutive quarters? That’s REALLY bad, right? Meh. Again, that is what the Fed wants to see before they loosen the economic leash.
These are strange times, indeed.
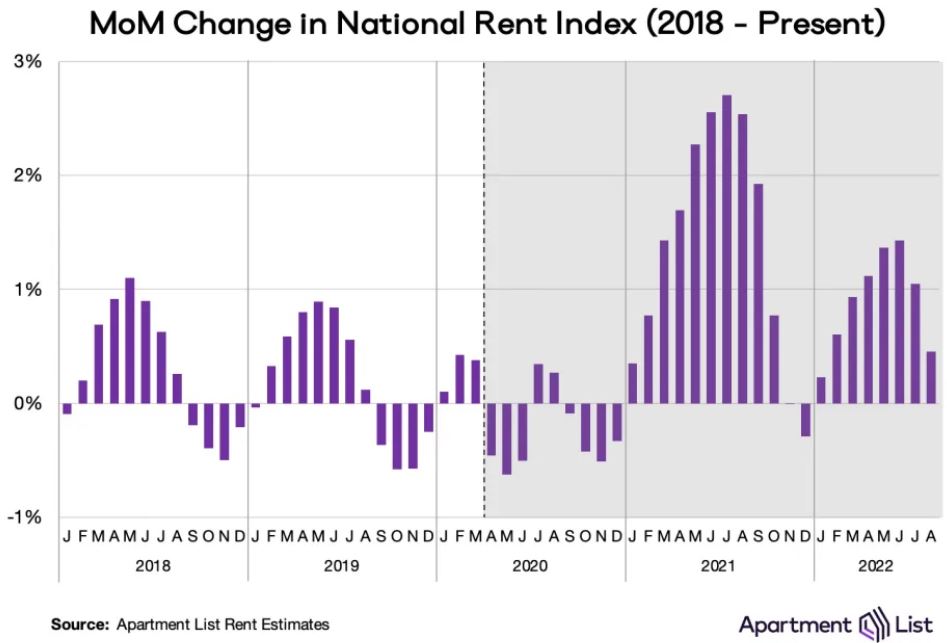
What comes next? Well, the next crucial CPI report is released on September 13th and will either negate or support (or both) some of the data outlined in this report. Shelter costs will be a crucial element to keep an eye on as we gauge whether or not the housing market has cooled due to higher mortgage rates. We have seen month-over-month national rent increases decrease since June, as illustrated in the chart below, with August rents increasing “just” +0.50%.
The FOMC then meets on September 20th through the 21st, and we should be looking at yet another rate hike. In recent months, the Fed has focused quite a bit on the labor market when justifying their historically hawkish policy decisions. With such a tight labor market and unemployment so low, they have argued that this should allow them to aggressively tighten the economic leash without completely choking off the economy.
This stance has always concerned me. We are in a very unusual period of time when it comes to the labor market. According to the July Job Openings and Labor Turnover Survey (JOLTS), there are 1.95 job openings for every unemployed job seeker, as seen in the chart below.
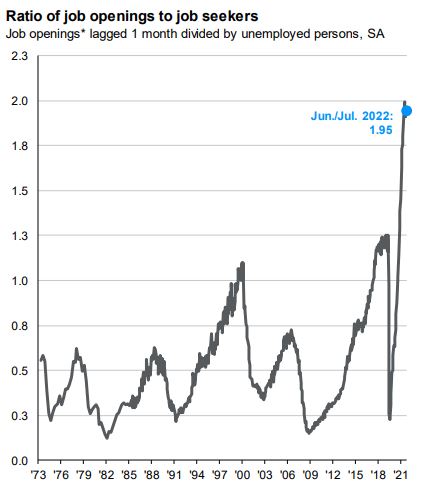
Source: JP Morgan Asset Management Guide to the Markets – JOLTS Survey
These are staggering jobs numbers, historically speaking. Yet, the United States economy has experienced negative GDP over the past two quarters. To me, there is a significant imbalance in the labor market. Low unemployment is not necessarily a sign of growth or expansion, but reflective of the fact that the United States needs a lot of workers simply to remain afloat.
Is this imbalance due to a demographic shift with baby boomers retiring or workers remaining on the sidelines after the “great resignation”? It is difficult to say, but I think the Fed needs to be very careful when justifying its policy decisions by using an economic input that appears so skewed at the moment.
For now, all eyes will shift to 8:30 a.m. eastern time on September 13th when the next CPI report is released. In the meantime, it is also important to closely monitor the Nord Stream 1 pipeline standoff to see if, indeed, we are seeing an escalation between Russia and the west.
Should we begin to see a two month positive trend related to inflation, as we are hoping for, we could see markets react with relief. Then, all focus will shift to the next FOMC meeting and the Fed’s policy decision announced during the afternoon of September 21, 2022.
Important note and disclosure: This article is intended to be informational in nature; it should not be used as the basis for investment decisions. You should seek the advice of an investment professional who understands your particular situation before making any decisions. Investments are subject to risks, including loss of principal. Past returns are not indicative of future results.
Share this
Stay Ahead with Smart Investments
Learn how to invest wisely and minimize risks to protect your retirement savings.

Achieve Your Retirement Goals
Get personalized advice to meet your retirement goals. Book your call with Destiny Capital now.