Markets & Economy Update – From Fear to FOMO
After nearly two decades as residents of Colorado, my wife and I made the difficult decision to relocate our family to our home state on the east coast back in early 2021. This decision came with plenty of positives and was largely driven by our desire to be closer to immediate family so our two boys could build meaningful and impactful relationships with grandparents, aunts, uncles, cousins and so forth. However, there was one negative aspect of this move that my wife and I grossly (pun intended) underestimated – east coast weather. I knew I would miss the seemingly-perpetual blue skies of Colorado, but I didn’t know just how much I would miss them.
East coast winters can be both dreary and dreadfully long. The bleak 10-day weather forecasts often leave my wife and I wondering “what the heck are we gonna do with the kids indoors for the next week-and-a-half!?” This is why I find this time of year so invigorating. Just when I think my Irish skin can’t get any more pallid, temperatures start to rise, we get some extra sunshine due to daylight savings, and we begin to emerge from our seasonal and sullen slumber.
Much like an east coast winter, investors have experienced a dreary and dreadfully long slog of market volatility since January of 2022. As seen in the chart below, we’ve seen plenty of market head-fakes over this period of time where markets would rise sharply only to decline once again as investors reacted with dismay to negative inflation news and increasingly-restrictive Fed policies.
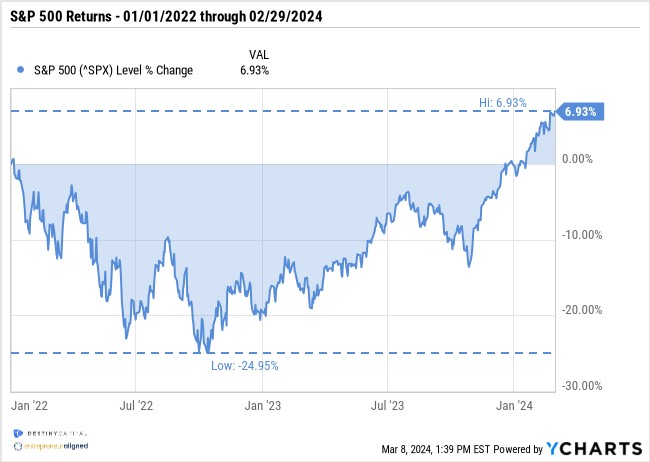
However, since late 2023, investor fortunes have been changing as inflation has slowly descended closer to the Fed’s 2% target. This fosters hope of eventual rate cuts that might spur economic growth and provide some tailwinds for key asset classes. In anticipation of this, the S&P 500 has moved sharply higher since the beginning of Q4 of 2023 as overall investor and consumer sentiment has improved. This begs the question, will financial markets continue to ‘spring forward’ along with daylight savings time, or is the market setting itself up for a correction?
The Fine Line Between Optimism and FOMO
We’ve clearly seen a bit of a linear ascent in the S&P 500 since late 2023, and that type of rally might concern some pundits. However, as the previous chart indicated, much of that resurgence was simply clawing back ground that had been lost throughout the 2022 selloff when the S&P 500 index bottomed-out around 3,600.
Still, when asset prices begin to surge, investor mindset can easily shift from optimism to irrational exuberance. Irrational exuberance can lead to FOMO (fear of missing out) behavior for some investors, which may exacerbate bubbles in certain stocks, sectors and/or asset classes.
Remember the frenzy in 2021 when a Reddit chatroom told everyone to dump money into the stock of AMC Entertainment Holdings Inc. (AMC Theaters)? Well, let’s see how that trade is doing today.
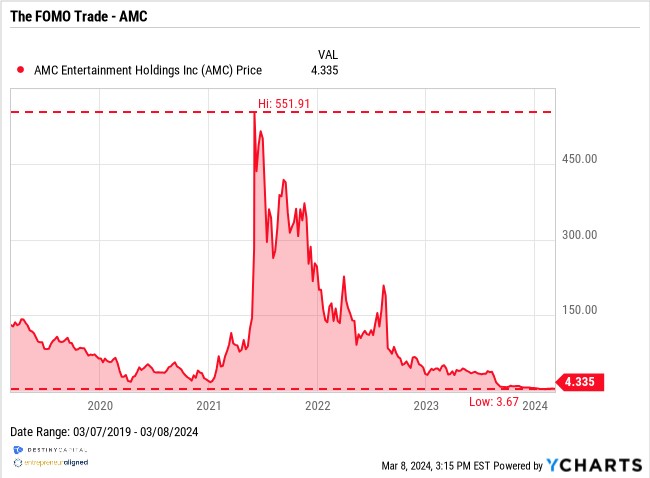
As with all pump-and-dump schemes, the ‘influencers’ hyping the stock likely profited nicely while the speculators who were late to the party ended up losing their shirt. After all, AMC stock once soared to a height of $551/share in June of 2021 and now trades as a penny stock at $4.33. So, a speculator who bought AMC at the market peak of $551 would ‘only’ need a return of roughly +12,625% from the current market price to break even.
In this most recent rally, we’ve once again seen a few high profile risk assets go parabolic – namely NVIDIA stock and Bitcoin. As you can see in the chart below, NVIDIA is up over 606% and Bitcoin is up 268% since October of 2022. Those are staggering returns that have garnered the attention of experienced and novice investors alike.
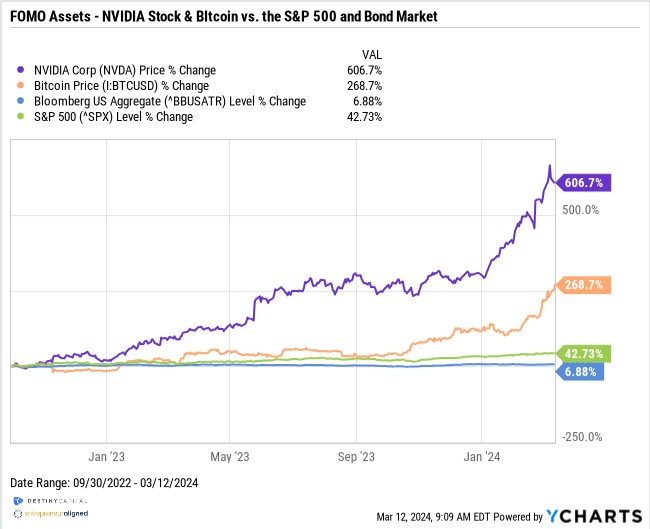
In the case of Bitcoin, we’ve seen a tremendous surge in the cryptocurrency’s price in recent months from roughly $42,000/BTC on January 1, 2024 to over $70,000/BTC by mid-March. Some of that surge could certainly be attributed to the SEC’s authorization of the release of spot Bitcoin exchange traded funds (ETFs) on January 11th.
These ETFs can provide everyday investors with efficient exposure to Bitcoin as a speculative part of an investment portfolio, and inflows to these funds have been significant. For example, one of the largest new ETF entrants has been the iShares Bitcoin ETF (IBIT), which has already grown to $14.2 billion in assets managed. By comparison, the popular gold fund SPDR Gold Minishares ETF (GLDM) has $6.78 billion in assets managed despite being released in June of 2018.
FOMO – Technically Speaking
I typically don’t like referencing technical charts in letters like this, but I thought it might help to illustrate and support our point about momentum and FOMO investing. A bit further down the page is a ‘candlestick’ chart that illustrates trading activity of the aforementioned iShares Bitcoin ETF (IBIT). In order to avoid getting into the technical weeds across the entire chart, I want to specifically draw your attention to the data seen within the blue square labeled ‘Volume & the Relative Strength Index (RSI)’.
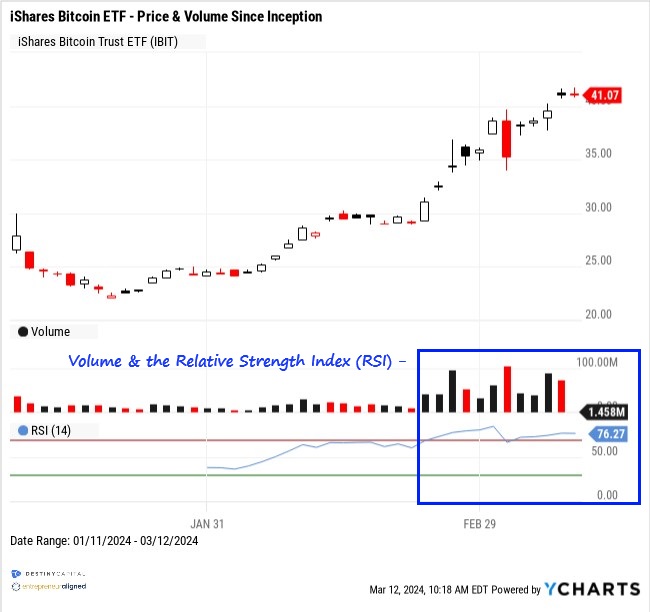
Within the square, the black and red bars illustrate daily trade volume (how many shares were bought/sold during the trading day) with taller vertical bars representing higher trade volume. They are red or black depending on whether or not the price closed higher (black) or lower (red) when compared to the previous day’s closing price. As you can see, a significant and persistent surge in volume began around February 25th. This is evident because the black & red bars suddenly grew much taller than they were over the preceding weeks. This persistent surge in daily volume has since coincided with a nearly +40% climb in the price of both the iShares Bitcoin ETF (IBIT) and Bitcoin itself. As more and more investors piled money into these Bitcoin ETFs, the price subsequently, and substantially, rose.
Below the red/black volume bars is a blue line that represents the Relative Strength Index (RSI). Briefly, the RSI is a momentum indicator that helps investors evaluate whether or not an asset is overbought (potentially overpriced) or oversold (potentially underpriced). An RSI reading above 70 (represented by the horizontal red line) would indicate that the asset is overbought and, as-of this writing, the iShares Bitcoin ETF Relative Strength Index sits well above that threshold at 76.27.
Similar technical dynamics around high volume and high Relative Strength exist when looking at NVIDIA stock, as well. Does this mean that both of these assets are due for a significant correction? Not necessarily. However, this technical data does suggest that there are a lot of dollars chasing these particular assets, which can drive prices to a point that isn’t supported by the underlying fundamentals. In the case of Bitcoin, there are no fundamentals – only supply/demand dynamics. In the case of NVIDIA, the stock could become ‘priced to perfection’ where just about everything would have to go perfectly and the company would have to continue to experience monumental growth each quarter in order to justify its elevated valuation.
Beyond technical and fundamental analysis, investors have a way that they can gauge an asset bubble in the comfort of their own homes. This is my ‘Theory of Relative-ity’. No, this has nothing to do with gravity’s effect on the stock market. It means that if, during a family gathering, you hear your know-it-all cousin, in-law, brother, sister, aunt, uncle, etc. vociferously proclaiming to anyone who will listen that “you need to buy XYZ stock or ABC crypto”, that’s usually a good sign that a bubble is forming in that particular stock or asset class, and you should stay far, far away.
Small Caps – Big Lag?
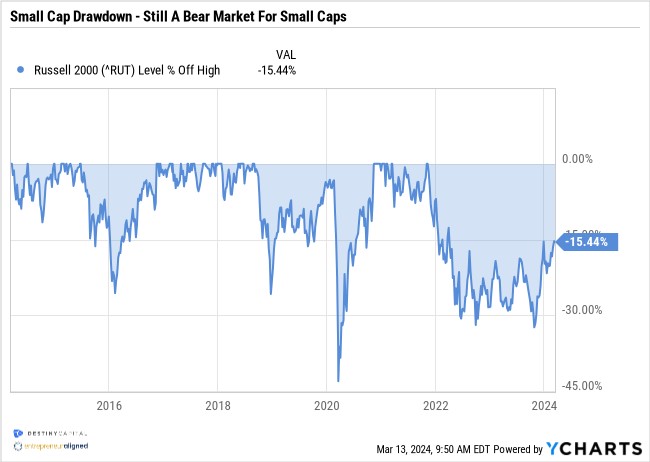
In many of our previous letters, we’ve noted that the recent market rally has not been entirely widespread across asset classes. Specifically, small caps (stock of smaller companies) have been conspicuously absent from the recent rally and, technically speaking, still remain in a bear market. To illustrate this, we look at the chart below which shows the ‘drawdown’ in small caps, which represents the percent decline in the small cap index relative to its previous market high. So, in the case of the Russell 2000 (Small Caps), the index remains -15.44% below its previous high back in late 2022 as seen below.
Typically, when investor sentiment turns bullish (positive), we would expect small cap stocks to surge much like large cap stocks have over the past few months. The fact that small cap stocks remain in a bear market is viewed by many pundits as a sign of overall market weakness. However, this may fail to account for the unusual circumstances of today.
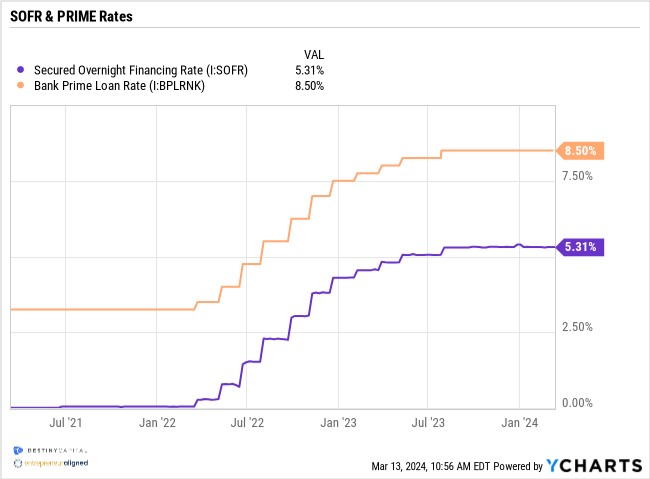
As we all know, in March of 2022, the Fed began an unprecedented series of rate hikes that moved interest rates from 0.00% to 5.25 % in roughly a year-and-a-half. This significantly raised the cost of borrowing for individuals and businesses alike. To illustrate this, we look at changes in the Prime Rate and SOFR (Secured Overnight FInancing Rate) which typically serve as benchmark interest rates for personal and business loans.
The current rate environment has hit small caps harder because these companies tend to have more debt, weaker balance sheets, and more variable rate debt. Therefore, the cost of borrowing has skyrocketed for these companies over the past two years. Couple that with a banking crisis that has tightened lending standards, and it has been tough sledding for small cap corporations seeking to fund operations or facilitate growth.
However, we do see a light at the end of the tunnel for small caps and other interest-rate sensitive asset classes like bonds. As interest rates inevitably decline from today’s restrictive levels, we expect that both small caps and bonds could experience some performance tailwinds. In his recent comments on Capitol Hill, Fed Chairman, Jerome Powell, stated, “We expect inflation to come down, the economy to keep growing. If that’s the case, it will be appropriate for interest rates to come down significantly over the coming years.”
When it comes to timing, our belief heading into 2024 was that the Fed would be patient and deliberate with an initial rate cut likely coming after the Federal Open Market Committee Meeting in either June or July. That stance remains consistent based on the data that has emerged from recent Consumer Price Index (CPI) and Personal Consumption Expenditure (PCE) inflation reports.
The Value of Diversification
In closing, it’s important to note that just because bubbles may form in certain stocks, sectors or asset classes, that doesn’t necessarily mean that a total market bubble is forming. Furthermore, today’s general commentary helps to accentuate the value of diversification and portfolio optimization. Over the past 3-5 years, Large Cap companies have done much of the heavy lifting within client portfolios by providing the lion’s share of total return. However, this won’t always be the case. There may come a time when the momentum in Large Cap stocks runs out of steam and, if/when this happens, investors need other portions of their portfolio to carry their share of the load.
Diversification allows us to identify which asset classes to own while portfolio optimization helps us to determine how much of an asset class to own. This type of calculus is ongoing and can change as the economy and financial markets evolve.
We expect the coming weeks to be eventful with the next FOMC meeting concluding on March 20th. We expect no action on interest rates to emerge until the June FOMC meeting, at the earliest.
In the meantime, it’s also important to note that the tax filing deadline is right around the corner. The Destiny Capital team of Strategists and Coordinators wanted me to stress to you that they are available to do a pre-filing tax return review for all clients who would like it. Historically, our team has identified that roughly 30% of client tax returns have some kind of error that requires an amendment. While we are not CPAs or EAs, our team has extensive knowledge of a client’s tax picture and can serve as a second set of eyes to potentially identify errors before the return is filed. If this is something you are interested in, please don’t hesitate to contact us.
Important note and disclosure: This article is intended to be informational in nature; it should not be used as the basis for investment decisions. You should seek the advice of an investment professional who understands your particular situation before making any decisions. Investments are subject to risks, including loss of principal. Past returns are not indicative of future results. Advisory services provided by Destiny Capital Corporation, a registered investment adviser.
Share this
Stay Ahead with Smart Investments
Learn how to invest wisely and minimize risks to protect your retirement savings.

Achieve Your Retirement Goals
Get personalized advice to meet your retirement goals. Book your call with Destiny Capital now.