Markets & Economy Update – Shifting Momentum
by Tim Doyle, CFP®, MBA
As a bit of a sports nut, I have to admit that the annual stretch between January and mid April is my favorite time of the sports year. There are great college football bowl games, intense NFL playoff matchups, March Madness, opening day of major league baseball, and then The Masters golf tournament is just the cherry on top. Sports are fun to monitor despite the fact that, between work and kids, I get a grand total of about seven seconds to watch any given sporting event.
One aspect of athletics that has always fascinated me both as a participant and as a spectator is the concept of momentum. Anyone familiar with athletics has likely experienced a momentum swing in one form or another. It could be a high school basketball game where your child or grandchild’s team is comfortably up by 14 points with six minutes left in the game.
Suddenly, the opposing team hits one shot then steals the ball and makes another quick and easy bucket. The opposing coach then employs the dreaded full-court press. Pressure builds, smiles begin to fade and players start to share furtive glances with one another. The once-raucous home crowd suddenly grows quiet as all eyes turn to a scoreboard clock that appears to be stuck in time. Before you know it, the clock strikes zero and the opposing team is jumping and hugging at mid court as a stunned crowd looks-on in disbelief. During these momentum shifts, it’s almost as if our collective subconsciousness inadvertently wills something into existence like some kind of self-fulfilling prophecy. When it starts to happen, everyone can just sense it.
Yes, the phenomenon of momentum is prevalent in sports, but we also see this dynamic play out in investing where sentiment shifts and markets move sharply in one direction or another. In recent weeks, negative momentum has suddenly taken hold and we now have pundits on TV and social media using scary words like ‘correction’ and ‘recession’.
What is causing this? Well, it’s been interesting to note that, for the first time in a while, we’ve seen a meaningful, downward shift in consumer sentiment as you can see in the chart below. This chart shows the results from the Consumer Sentiment survey conducted by the University of Michigan which helps to measure how U.S. households feel about personal finances, business conditions, and other key topics related to the U.S. economy. Since the beginning of 2025, we’ve seen a steep decline in sentiment from about 74 down to roughly 57. In fact, overall consumer sentiment is approaching levels last seen during the great financial crisis of 2008 (55) and the all-time low recorded during the inflation spike of 2022 (50). While overall economic conditions remain strong, it’s as though consumers are sensing that a momentum shift is just beginning.

Why is consumer sentiment important? Well, consumption (the total value of goods & services purchased by U.S. households) represents roughly 68% of Gross Domestic Product (GDP) in the United States. As I’ve said many times, “as goes the consumer, so goes the U.S. economy.” This helps to explain why economists and analysts pay so much attention to changes in consumer behavior over time. If consumers are happy and optimistic, they tend to spend and this could be additive to GDP growth. If consumers are pessimistic, they may tighten their belts and spend less freely, and this could cause a broad slowdown in growth. As you may know, a recession is loosely defined as two consecutive quarters of negative GDP growth.
We’ve also seen a significant shift in consumer inflation expectations in recent weeks, and this can be seen in the chart below. This particular chart shows consumer expectations for inflation (CPI) over the short-term (green line) and over the long-run (blue line). As you can see, consumers are now expecting significantly higher prices over both the near and long-term.

Consumer inflation expectations are important because when the Federal Reserve proclaims that long-term inflation remains ‘well anchored’, they are referring to both the Fed’s internal projections and consumer expectations. If, as this chart indicates, consumers believe that CPI is going to rise to 5% in twelve months and will remain elevated at 4% over the long run, then that is certainly going to capture the Fed’s attention and could influence future policy decisions around interest rates.
What is causing such a drastic shift in consumer sentiment? Well, in large part, it’s likely due to the uncertainty around U.S. trade policy and how it might impact the global economy. By now, most consumers have learned that tariffs on imported goods are paid by domestic corporations like WalMart, Home Depot, Target, IKEA, Amazon and many more.
For U.S. corporations, paying tariffs can increase costs and, subsequently, reduce profitability. Trust me, corporate CEO’s and CFO’s do not like to get on earnings calls with investors and analysts to report declining profits. Yes, there could be some price negotiation between foreign exporters and U.S. importers, but it’s likely that U.S. corporations will pass on some element of the added cost to consumers.
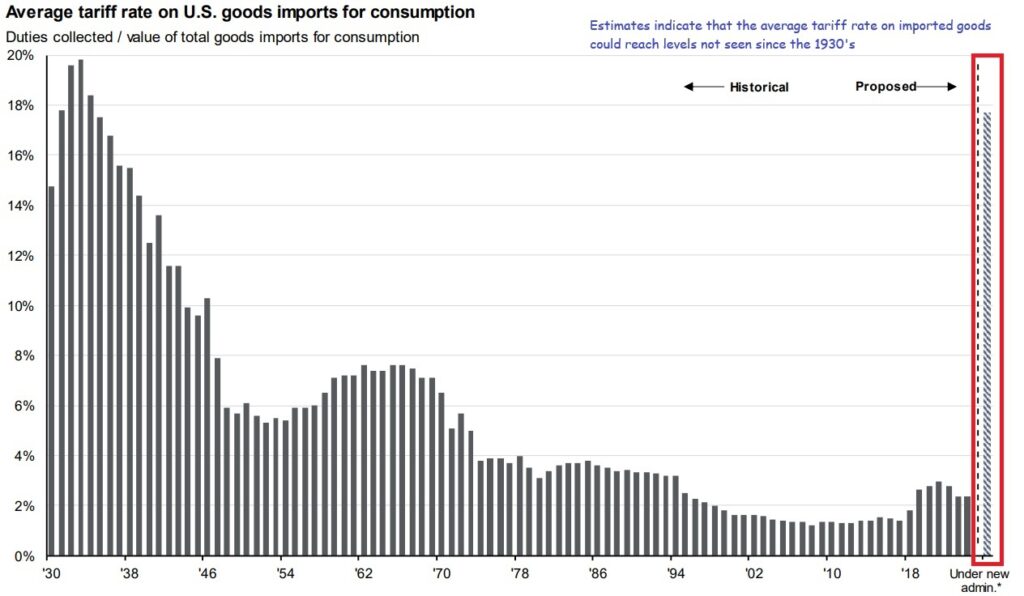
If tariffs were targeted to certain goods or industries like steel or autos, there might be less concern about broad inflationary pressures. However, to give you a sense for how impactful these tariffs might be, we look at the chart below that shows the average tariff rate on goods imported to the United States throughout history relative to the tariffs proposed by the Trump administration. As you can see as highlighted in red, trade policy proposals could increase the average tariff rate on U.S. goods imports to nearly 18% – levels not seen since the 1930’s.

Clearly these are only estimates and we have yet to see policy in-action from the Trump administration. However, given the broad scope of the tariffs being discussed, consumers are now expecting higher aggregate prices across the board which might help to explain the sudden spike in inflation expectations in the previous chart.
Navigating Uncertainty
The latest reports from Washington D.C. indicate that we can expect big news around tariffs and trade policy on April 2nd. As previously indicated, new tariffs are expected to be broad and could impact nearly all goods and include nearly all trade partners of the United States. Still, a tremendous amount of uncertainty remains and, understandably, this can be unnerving for many investors.
When uncertainty abounds and momentum starts to shift in a negative direction, it’s important to remain disciplined and stick with your long-term plan. This is not much different than when I spoke about momentum in sports at the beginning of this letter. For example, in my lifetime, I’ve seen many NCAA and NFL football teams who created their offensive identity around running the football. For these teams, the running game was central to every game plan, and it’s often been very successful and led to a lot of victories. However, I’ve also seen many games where one of these teams abandon their game plan once adversity strikes during the game. They deviate from their game plan with the hope that some change, any change, will swing momentum back in their favor. This inevitably backfires and only exacerbates the problem, causing the negative momentum to snowball.
When volatility strikes, many investors find themselves tempted to deviate from their game plan and do two things – sell to cash and/or chase returns. When it comes to selling to cash, this strategy is fraught for a few reasons.
If the intent is to ‘tap out’ of the markets and remain in cash over the long term, this can significantly impact long-term financial goals. If the past few years have taught us anything, it’s that inflation can have a significant impact on purchasing power over time. Therefore, investing is crucial to help overcome the erosion of purchasing power caused by rising aggregate prices.
This can be seen in the 10-year chart below that shows returns of the S&P 500 Index (green) along with the decline in purchasing power of the U.S. dollar in red. As you can see, remaining invested helps consumers overcome rising prices and a decline in the purchasing power of the dollar over the long-run.

Furthermore, even if the intent is to remain in cash for just a few weeks or months, it is impossible to time the market and know exactly when stocks will move in one direction or another over time. Historically, when investors head for the exits, they do so at exactly the wrong time. To illustrate this point, we only have to look back about five years to learn a critical lesson from the past.
The chart below shows mutual fund and exchange traded fund (ETF) flows between the beginning of 2020 and the end of 2021. By ‘flows’, I am essentially referring to whether or not investors are selling or buying mutual funds and ETFs at any given time. In this chart, a negative number indicates that investors are selling out of the market. This chart also shows movement in the S&P 500 index (blue) over that same period of time.

As you can see above, mutual funds and ETFs experienced massive outflows (investors selling out of the market) around the time that the S&P 500 bottomed-out in March of 2020 as fears of a global shutdown peaked. I’d imagine that many of these investors were hoping to ‘wait it out’ as the economy grappled with fallout from the COVID-19 pandemic. Clearly, it would take some time for the pandemic dust to settle, right? Well, the stock market had different ideas, and the S&P 500 sharply reversed course.
After a top-to-bottom decline of over -30% between February and March of 2020, the stock market suddenly and sharply climbed higher and higher. By August, the S&P 500 index had recouped all losses and even ended the year with a calendar year gain of +18%. If, by selling to cash at-or-near the March bottom, an investor missed even some of that market rally, the fallout could’ve been catastrophic for their long-term financial goals.
Chasing Returns
When it comes to chasing returns, it can be very tempting to allocate capital to asset classes that might be holding-up better than others during times of volatility. In fact, as an example of this, it’s been interesting to track the outperformance of international stocks relative to U.S. stocks thus far in 2025.
We can see this dynamic in the year-to-date chart below that shows the performance of the All Country World Index Ex-US (aka everybody but America) ETF versus the S&P 500 Index ETF (SPY). As you can see, global stocks are actually up +7% so far this year while domestic stocks are down nearly -5% as-of this writing.

Does this mean that investors need to shift significant capital to international stocks? Well, not necessarily. As I’ve indicated throughout this letter, there is a tremendous amount of uncertainty across the global economy. We currently have very little inkling for how U.S. trade policy may impact regions like the Eurozone or emerging markets, for example.
We also have to look at allocations through a longer-term lens. Over the past fifteen years, I can’t tell you how many analysts, fund managers, and executives have predicted that international stocks would outperform U.S. stocks. Yet, see the chart below that shows the historical returns of the S&P 500 Index (blue) versus International stocks (orange) over that fifteen year timeframe.

That’s right, over the past fifteen years, U.S. stocks have produced a total return of +570% versus +115% for the rest of the world. For those analysts, fund managers and executives who were consistently banging the drum to over-allocate to international stocks during thai time, they sure paid a steep price for this “I told you so” moment.
To be clear, international stocks can absolutely play an important role in a diversified investment portfolio. International stocks tend to pay higher dividends than U.S. stocks and offer hedges around currency risk, political risk, geographic risk and more. Still, I’d imagine if I asked ten investment managers which company they thought had the greatest growth potential over the next ten years, NVIDIA or Nestle, I’d wager that most would pick the former.
The point I am trying to make is that when so much uncertainty exists, it can be difficult to make meaningful portfolio changes with any level of firm conviction. This is like when you’re stuck in traffic and the lane next to you seems to be moving at a decent clip. Any Colorado resident or visitor who has traveled to the mountains on I-70 has experienced this. As soon as you decide to shift into that other lane, the brake lights illuminate and the lane you just left starts moving along.
One thing is for certain, we can expect continued change in the weeks and months ahead. What’s somewhat reassuring, however, is that we will likely get some additional clarity around trade policy and tariffs in the coming days. This can help corporations and investors truly assess the investing landscape to see what countries, sectors, industries, and corporations might be impacted – for good or ill – by these changes.
If you haven’t already, I would encourage you to read my Note on Volatility released a few short weeks ago. While I think daily market volatility may be the ‘new normal’ for a period of time, please rest assured that we are monitoring events by the minute and will communicate with investors as meaningful updates emerge. In the meantime, please reach out to our team with any questions or concerns about your portfolio, your financial plan, or if you simply need someone to talk to about how you’re feeling during this stressful time. We’re here whenever you need us.
Important note and disclosure: This article is intended to be informational in nature; it should not be used as the basis for investment decisions. You should seek the advice of an investment professional who understands your particular situation before making any decisions. Investments are subject to risks, including loss of principal. Past returns are not indicative of future results. Advisory services offered through Destiny Capital Corporation, an Investment Adviser registered with the U.S. Securities & Exchange Commission.
2024 YCharts, Inc. All Rights Reserved. YCharts, Inc. (“YCharts’) is not registered with the U.S. Securities and Exchange Commission (or with the securities regulatory authority or body of any state or any other jurisdiction) as an investment adviser, broker-dealer or in any other capacity, and does not purport to provide investment advice or make investment recommendations. This report has been generated using data manually input by the creator of this report combined with data and calculations from YCharts.com and is intended solely to assist you or your investment or other adviser(s) in conducting investment research. You should not construe this report as an offer to buy or sell, as a solicitation of an offer to buy or see, or as a recommendation to buy, sell, hold or trade, any security or other financial instrument. THE IMPORTANT DISCLOSURES FOUND AT THE END OF THIS REPORT (WHICH INCLUDE DEFINITIONS OF CERTAIN TERMS USED IN THIS REPORT) ARE AN INTEGRAL PART OF THIS REPORT AND MUST BE READ IN CONJUNCTION WITH YOUR REVIEW OF THIS REPORT. Disclosure – YCharts
Share this
Stay Ahead with Smart Investments
Learn how to invest wisely and minimize risks to protect your retirement savings.
Achieve Your Retirement Goals
Get personalized advice to meet your retirement goals. Book your call with Destiny Capital now.


