Markets and Economy – The 2025 Year in Review
by Tim Doyle, Chief Investment Officer, CFP®, MBA
After graduating from college many years ago, my parents hosted a gathering of family and friends to celebrate such a key milestone in my life. That day, I recall that just about every adult at the party approached me with some version of the question “so, what are you going to do with your life?” Thankfully, I was smart enough to know that “I want to move to Colorado and be a ski bum” was not an acceptable answer.
Still, at the time, I didn’t know exactly what job title and career path was on the immediate horizon for me. However, I always had a strong sense for what I wanted to be doing every day. For me, it was, and always has been, essential that I learn something new every day. I truly enjoy facing ongoing challenges that require me, and my organization, to be curious, adaptive, and inventive every single day. When I first entered the field of banking and investment management, I quickly realized that I was on a career path that checked all of these boxes. After all, the landscape of finance and investing is constantly shifting as policies change, markets rise and fall, economies expand and contract, new companies emerge, laws change, geopolitical conflict escalates, prices rise or fall, and much more. In fact, in the world of investing, we call this type of non-stop action ‘Tuesday’.
2025 has not been without its fair share of drama and rapid-fire change, to say the least. We’ve seen trade deals scuttled, new laws passed, changes in policies, surges in asset prices, and much more. So, in this month’s letter, we’ll take a look back at the year that was to highlight what changed across the economy, what moved markets higher or lower, and helped investors get to where we are today with 2026 on the immediate horizon. We’ll begin this month’s letter with what caused the biggest shock to the system in 2025 – the new trade policies implemented by the United States.
Liberation Day and Changes to U.S. Trade Policy
In early April, I tuned in to live video coverage on my workstation to watch as President Trump announced his new trade policies on a day his administration dubbed ‘Liberation Day’. At the time, conventional wisdom among investors was that there would likely be targeted tariffs against certain countries, sectors or products where trade policies were deemed egregious or unfair to the U.S. Investors also believed that some sort of 10% universal tariff could also be in play. The truth was that economists and investors had no idea what to expect, so we all watched in rapt attention to see what impact, if any, new U.S. trade policies would have on the global economy.
Given that backdrop, many investors, including myself, reacted with astonishment when President Trump stood outside the White House and held a board aloft that detailed the administration’s new Reciprocal Tariff policies, as seen in the abbreviated chart below.
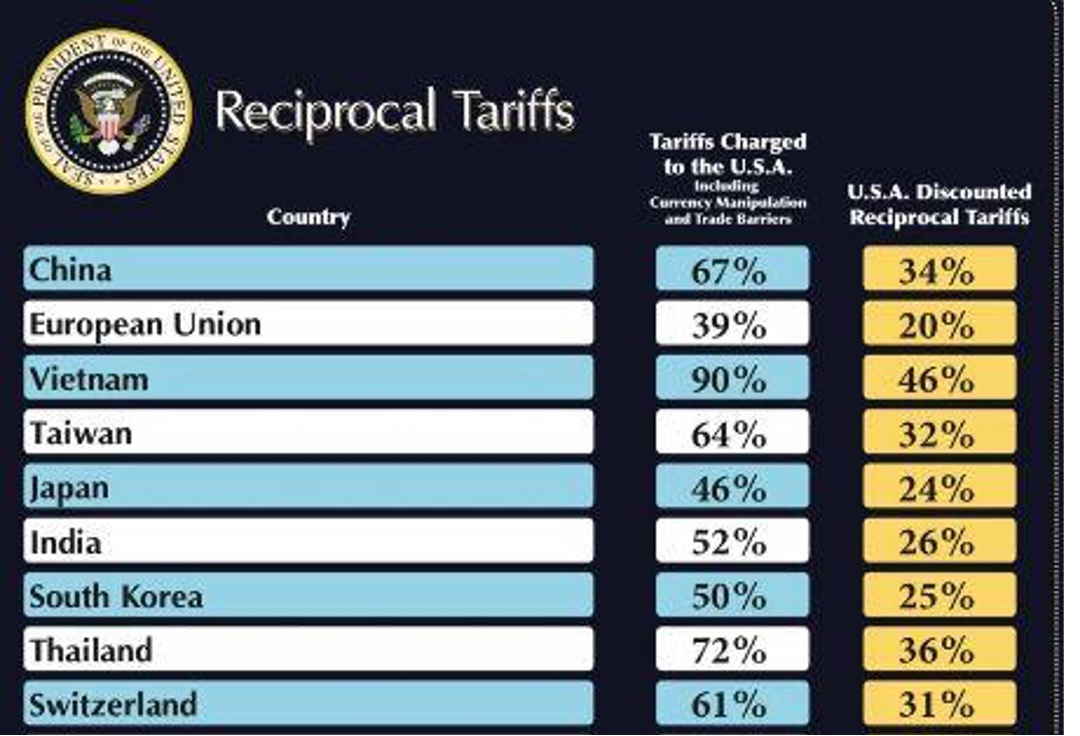
To many, these numbers were astonishing, and far higher than anyone anticipated. Suddenly, in just a few short days, the rules of the road for international trade had been re-written, and the effective tariff rate on goods imported into the U.S. went from roughly 2.5% to 30% – levels not seen since the early 1900’s, as seen in the chart below.
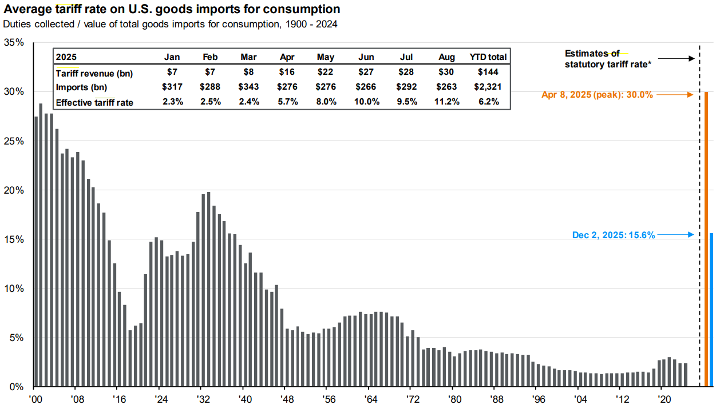
Source: JP Morgan Asset Management – Guide to the Markets
These tariffs sent shockwaves across the global economy, and investors emphatically did not like what they were seeing or hearing. The S&P 500 subsequently declined roughly -12% in just a few short days. Perhaps even more alarming was the sudden spike in the 10-year Treasury Rate which rapidly rose nearly 0.50% in a week. It is abnormal for treasury rates to rise that much in such a short time, so alarm bells were sounding across bond markets.
Regardless, the stock and bond market’s reaction to these steep new tariffs caught the attention of the Trump administration, and they quickly walked back many of these new policies by pausing the implementation of many of these new tariffs. As it stands today, the effective statutory tariff rate on foreign imports into the U.S. is estimated to be 15.6%. These are tariff rates not seen since the late 1930’s, and still have a meaningful impact on global trade and have had a direct impact on our next important topic – inflation.
Higher Prices – Unhappy Consumers
Inflation is simply the story that won’t die. For roughly three years, I’ve been tracking price movements and communicating the potential impact that inflation might have on the U.S. economy and financial markets. Since inflation peaked at 9.1% in June of 2022, prices had been on a slow trajectory back down towards the Fed’s 2% target. In fact, headline CPI had fallen to 2.3% in April of 2025, which represented levels not seen since 2021.
However, over the subsequent months, we saw inflation begin to tick-up again in late Spring, and it gradually surged back up to 3.0% as of the latest September reading. To quote Michael Corleone in The Godfather III, “just when I thought I was out, they pull me back in!” and, yet again, inflation is still top-of-mind for investors as it remains a significant source of economic uncertainty and a key driver of Fed policy.
The primary culprits behind this increase in inflation are Core Goods and Food at Home, and these are elements of inflation that have been heavily impacted by changes in U.S. trade policy. As I’ve communicated many times this year, U.S. importers like WalMart, Lowes, Home Depot, Ikea, and many more are responsible for paying all applicable tariffs on foreign goods imported into the United States. These tariffs are an added expense for these corporations, so they have two immediate options for how they might handle these added costs. These corporations can either absorb these added expenses, which will lower profitability, or they can pass-on this added expense to consumers in the form of higher prices.
As additional inflation data was released each month, it became apparent that the U.S. corporations were passing on this added cost to consumers in the form of higher prices. This can be seen in the chart below that shows the contributors to headline inflation. As you can see on the far right of this chart (highlighted in red), much of the recent surge in CPI is due to Core Goods (orange bar) and Food at Home (purple bar).

Source: JP Morgan Asset Management – Guide to the Markets
If the inflation spike of 2022 taught me one thing, it’s that higher prices have a significant impact on consumer mindset. This can be seen in the chart below that shows Consumer Sentiment levels as derived from a monthly survey conducted by the University of Michigan.
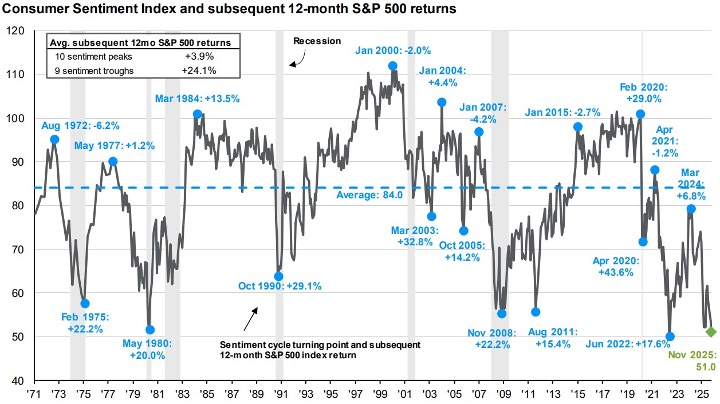
Source: JP Morgan Asset Management – Guide to the Markets
At the end of 2024, consumer sentiment remained at a solid level with a survey result of 74. However, sentiment rapidly fell off a cliff in early 2025 as new U.S. trade policies caused uncertainty and as inflation continued to move higher and higher after each CPI report. As of the latest November survey, consumer sentiment now sits at 51, which happens to be lower than we saw during the depths of the 2008 great financial crisis.
Generally speaking, consumer sentiment is important because consumption represents roughly two-thirds of U.S. Gross Domestic Product (GDP). If consumers tighten their belts and stop spending, economic growth could suffer. Fortunately, consumer pessimism has not yet impacted consumer behavior to a significant extent. Furthermore, the Federal Reserve claims that the price impact of tariffs should be short-lived, but investors have heard that story before and, understandably, remain skeptical that we’ll see inflation declining back to the Fed’s 2% target in the near future.
International Equities – Their Day in the Sun
This time last year, I’d wager that most investors weren’t envisioning the surge we’ve seen across international developed and emerging market equities. I think that many analysts were expecting yet another year of American exceptionalism with U.S. stocks dominating in the same way they have for nearly two decades.
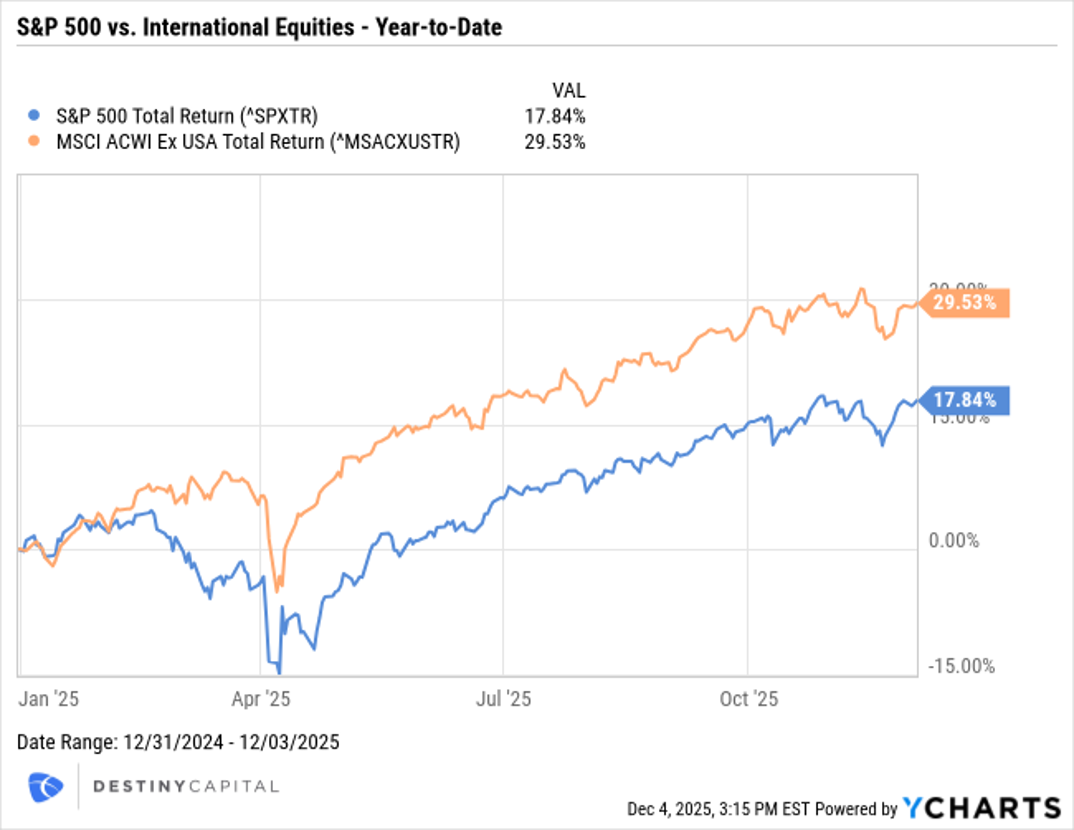
While U.S. stocks have delivered excellent returns year-to-date, they’ve been outperformed by international stocks by a significant spread as you can see in the chart below that illustrates the year-to-date returns of the S&P 500 (blue) versus the MSCI All Country World Ex-USA Index (orange). It’s been many, many years since international equities outperformed U.S. stocks by 10% or more.
The reasons for the international equity boom are many, including:
- Policy Shifts: regions like the Eurozone have shifted from policies of austerity to those of fiscal stimulus. This can be seen particularly in the EU’s commitment to defense and infrastructure spending.
- Relative Valuations and Concerns about the U.S. Outlook: early in 2025, international stock prices were considered cheap relative to U.S. stocks, causing some investors to rotate capital into international and emerging market stocks. Furthermore, there were fears that the new U.S. trade policies could lead to trade wars that might increase the risk of recession in the United States.
- Currency Tailwinds: in 2025, the U.S. dollar declined roughly -10% relative to other currencies like the Euro, Yen and more. International stocks are owned in the currency in which they are domiciled so, for example, the stock of a German corporation will receive a currency tailwind when the U.S. dollar declines relative to the Euro. For Eurozone stocks, currency tailwinds alone added between 10%-14% to total returns in 2025.
There’s more to the story, but the important thing for investors to consider is whether or not this international outperformance is a blip, or if it’s the beginning of a longer term trend like we saw in the mid 2000’s. To help gauge this, we’ll focus on Eurozone equities, which have been top performers with a 36.6% year-to-date total return as-of this writing.
Without getting too technical, it’s important to note that returns tend come from four sources:
- Multiples or ‘Multiple Expansion’: multiple expansion occurs when investors are simply willing to pay more for a stock per dollar of earnings. This tends to happen when investors are optimistic about the potential for future revenue and/or earnings growth.
- Currency Effects: this was detailed above when we outlined how international stocks can receive a performance boost when the U.S. dollar falls.
- Dividends: any periodic dividends paid by corporations are additive to total returns.
- Earnings: in our view, earnings growth is the greatest contributor to shareholder value for long-term investors. Therefore, earnings are the most important element to consider when analyzing the composition of returns across different regions.
We can use the chart below to help detail this further, as this visual helps to illustrate the sources of total return across regions, including the Eurozone and the United States. As we stated previously, Eurozone equities have produced a 36.6% total return thus far in 2025. However, as you can see in the column to the far left below, the vast majority of Eurozone returns have been derived from currency tailwinds (falling dollar) and multiple expansion (investor optimism). In fact, roughly 28% of the 36% Eurozone total return has come from these two contributors. However, Eurozone earnings have been somewhat paltry as a contributor to total return, particularly compared to earnings from U.S. stocks. The areas in red below help to highlight these differences.
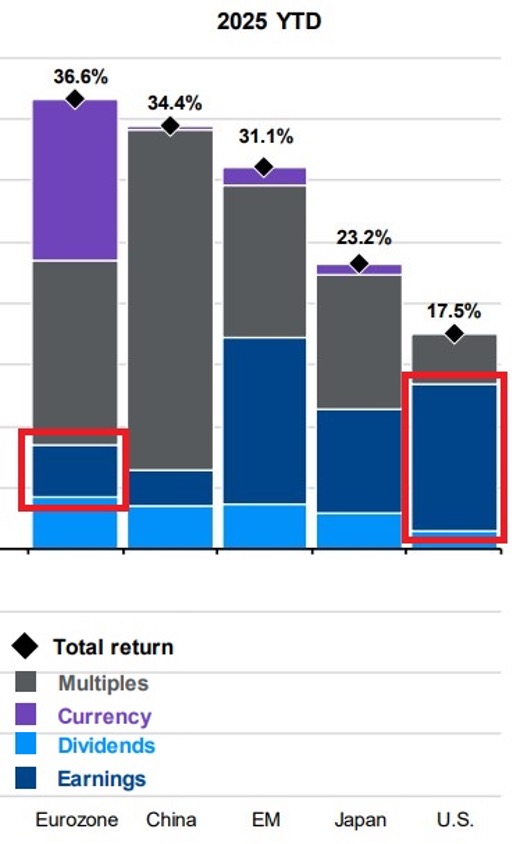
Source: JP Morgan Asset Management – Guide to the Markets
Bottom line – can U.S. investors rely on currency tailwinds and investor optimism to drive Eurozone stock prices even higher in the months and years ahead? Without those two significant contributors, 2025 returns would’ve been closer to 8%. While international stocks can absolutely play a role in a diversified investment portfolio, at Destiny Capital, we still believe that U.S. stocks have the greatest potential for earnings growth both now and in the years ahead. Therefore, unless we see some significant changes in the underlying fundamentals of international stocks, we still believe we remain in a period of American exceptionalism, at least when it comes to the global stock market.
A.I. Captain!
On November 30, 2022, OpenAI launched its groundbreaking large language model named ChatGPT. The capabilities of this innovative tool immediately captured the imaginations of corporate executives and investors across the globe. Since late 2022, an AI arms race, of sorts, has emerged that has resulted in massive levels of corporate spending and pushed the stock market higher and higher.
As it stands now, the main corporate players in this space include many of the names we’ve been highlighting for years – the Magnificent Seven (Alphabet, Apple, Amazon, Nvidia, Meta, Microsoft, & Tesla). Many of these companies are considered among the ‘AI hyperscalers’ who are spending hundreds of billions of dollars on AI infrastructure such as data centers, which are facilities that house computing hardware, high-speed networking, and data storage that’s required to train and run AI models.
As you can see in the chart below, spending and build-out are only expected to accelerate in the years ahead. In fact, in 2024, total hyperscaler spend on AI infrastructure was roughly $211 billion. By 2027, that total spend is projected to reach $542 billion, as illustrated in the light grey bar at the far right of the chart below.
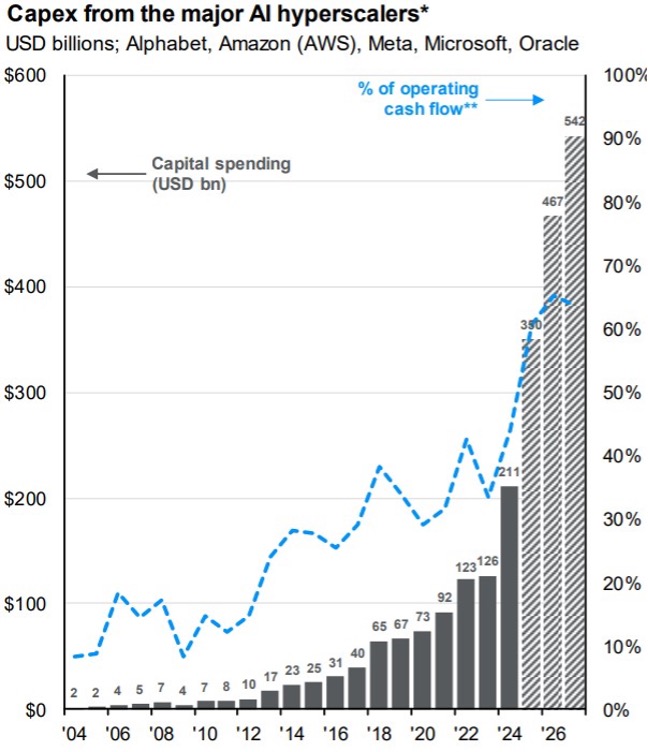
Source: JP Morgan Asset Management – Guide to the Markets
As a result of this immense spending spree, the U.S. is the world leader in data center build-out thus far, with roughly 4,165 data centers constructed in the U.S. as-of November 2025. The chart below helps to illustrate the fact that the U.S. is a clear global leader in AI infrastructure, with roughly 38% of all data centers residing in the United States.
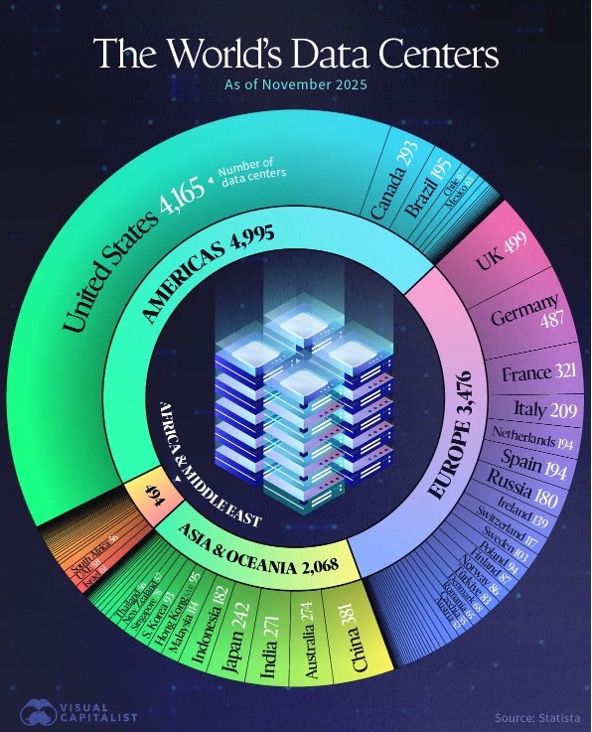
Source: Visual Capitalist & Statista
It’s also important to note that AI data centers require vast amounts of energy, and this is something that will be an area of focus for corporations, utilities, citizens and even regulators in the years ahead. In fact, an interesting example of this demand for energy is the 20-year agreement that Microsoft penned with Constellation Energy to restart the Three Mile Island nuclear reactor in Pennsylvania. It is expected that this plant could supply roughly 800 megawatts of power to Microsoft’s cloud and AI data centers. As a frame of reference, it is estimated that 800 megawatts could power between 550,000 and 800,000 homes in the U.S., depending on energy consumption patterns and efficiency.
When it comes to the AI revolution, we are still very much in the early stages where corporations are rapidly building the infrastructure required for AI to reach what they deem to be its ‘full potential’. As it stands now, there are AI ‘enablers’ – companies who provide the infrastructure and technology needed for AI such as chips and data centers. An easy example of an AI enabler is NVIDIA, whose GPUs, networking, and software are crucial to future AI build-out. To-date, enablers have been the primary beneficiary of the recent AI boom in the stock market.
However, in the coming years, we will likely move from ‘enablers’ to ‘engagers’, and these will be companies that utilize AI tech to improve products & services, increase productivity, and boost earnings. This will likely be a time when the impact of AI is disbursed more broadly across companies in the U.S. stock market, not just the Magnificent Seven.
In fact, we’re starting to see AI adoption accelerate, as you can see in the chart below that shows the percentage of businesses by sector that are utilizing AI to produce goods as services. As you can see, 29% of all IT companies are utilizing AI to produce goods & services, and that percentage is expected to increase to roughly 35% in just the next six months.
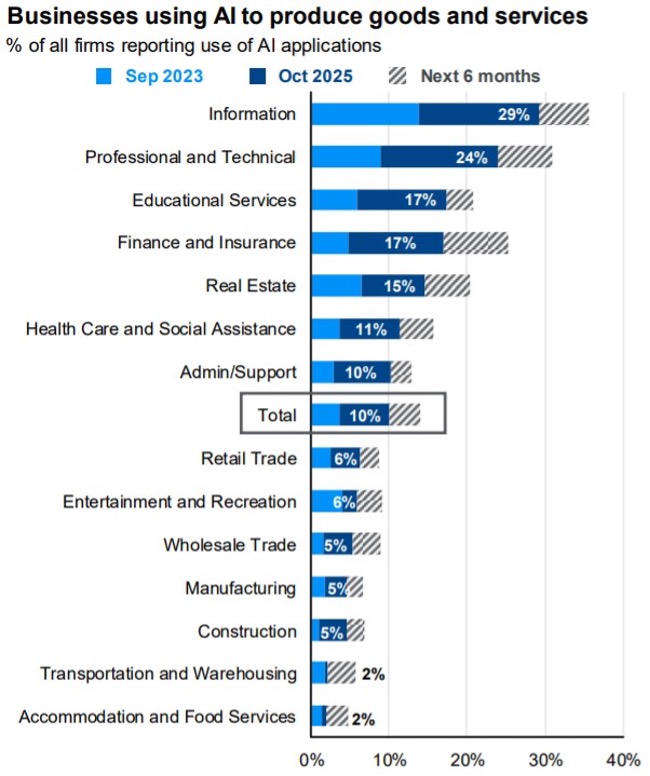
Source: JP Morgan Asset Management – Guide to the Markets
However, as with any emerging technology, uncertainty remains and there will be winners and losers that will emerge. For example, when we look back at the advent of the internet and the dot com boom, for every Google, there was an AOL or Lycos, and for every Amazon there was a Pets.com. Cautionary tales abound. While it’s always exciting to be an investor when a new, disruptive technology is introduced, it often pays to be diligent and disciplined, and that’s the approach we intend to take with AI investing here at Destiny Capital.
Asset Class Returns & Earnings
While there’s plenty of headline-worthy events we could still review including the OBBA tax bill, the government shutdown, and much more, we’ll close on a positive note by highlighting 2025 asset class returns and recent corporate earnings. It’s been another banner year for the U.S. stock, with all major stock indexes exceeding double digit returns as-of this writing.
In fact, this has been a year of redemption for several asset classes that have struggled mightily since the aftermath of the COVID-19 pandemic, including U.S. bonds and small cap stocks. Both asset classes have been boosted by lower interest rates and a stronger outlook, with U.S. bonds up 7.1% while small caps (as measured by the Russell 2000 index below) are up a very solid 14.9%.
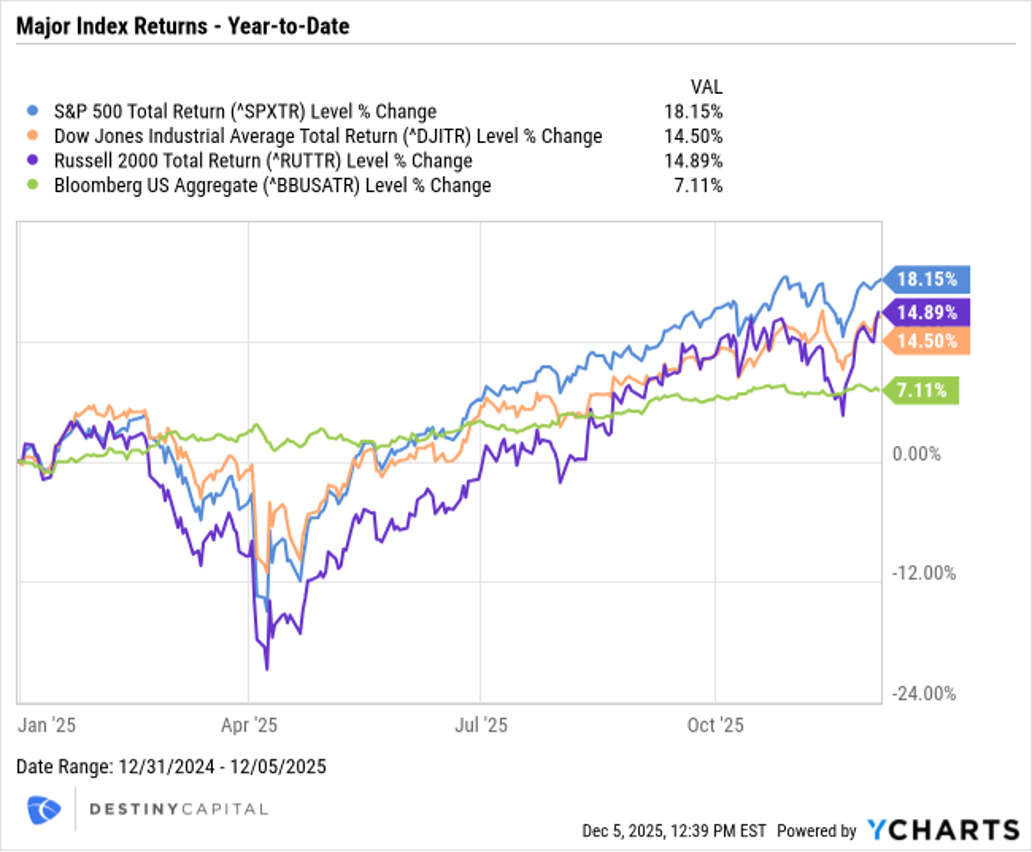
What’s even more staggering has been the rebound that the stock market experienced after the Trump Administration’s Liberation Day tariffs were paused on April 8th. Since that day, the Russell 2000 Index (small caps), the S&P 500 Index, and the Dow Jones Industrial Average Index have surged +45%, +39%, and +29% respectively. That is a rebound reminiscent of March of 2020 when the stock market was boosted by historic fiscal and economic stimulus due to the global shutdown caused by the COVID-19 pandemic.
When it comes to corporate earnings, Q3 2025 earnings season did not disappoint as S&P 500 companies reported strong numbers when looking at three key elements – revenues, earnings and profit margins. When considering revenue growth in Q3 of 2025, S&P 500 companies reported a very strong revenue growth rate of 8.4%. In fact, this marks the highest revenue growth rate since 2022.
When looking at earnings, S&P 500 companies reported a very strong blended earnings growth rate of 13.4%, which marks the fourth consecutive quarter of double-digit earnings growth. Finally, S&P 500 corporations reported a blended net profit margin of 13.1%, which represents the largest net profit margin ever recorded since FactSet began tracking this data back in 2009. So much for tariffs eating into profits, eh?
The bottom line is that, between asset class returns and corporate earnings, there is a lot for investors to be thankful for in 2025. As we look ahead to 2026, we’ll be tracking many of the topics and themes outlined in this letter. Will inflation stabilize and return back to the Fed’s 2% target? How disruptive will AI be and how will this new technology shape the global economy?
Furthermore, will tariff policies remain intact? In fact, in 2026, we expect to get a U.S. Supreme Court ruling on the legality of many of the Trump Administration’s tariffs. While that’s not a topic gaining much press today, I expect that this ruling could have a significant impact on global trade and financial markets, particularly if the tariffs are deemed unlawful under the International Emergency Economic Powers Act (IEEPA).
With all that and more on the horizon, 2026 should be a fascinating year, to say the least. On behalf of the Destiny Capital team, I want to thank you all for trusting us to help you navigate this world of personal finance and investing for yet another year. We are a growing firm, so please let us know if there is anyone in your orbit – family, friends, neighbors, coworkers – who might benefit from some financial guidance and/or investing advice. After all, at Destiny Capital, it’s our mission to positively impact as many individuals, families and businesses as we can. In the meantime, thank you for reading these letters each month, and I hope you have a wonderful Holiday Season and Happy New Year!
Important note and disclosure: This article is intended to be informational in nature; it should not be used as the basis for investment decisions. You should seek the advice of an investment professional who understands your particular situation before making any decisions. Investments are subject to risks, including loss of principal. Past returns are not indicative of future results. Advisory services offered through Destiny Capital Corporation, an Investment Adviser registered with the U.S. Securities & Exchange Commission.
2024 YCharts, Inc. All Rights Reserved. YCharts, Inc. (“YCharts’) is not registered with the U.S. Securities and Exchange Commission (or with the securities regulatory authority or body of any state or any other jurisdiction) as an investment adviser, broker-dealer or in any other capacity, and does not purport to provide investment advice or make investment recommendations. This report has been generated using data manually input by the creator of this report combined with data and calculations from YCharts.com and is intended solely to assist you or your investment or other adviser(s) in conducting investment research. You should not construe this report as an offer to buy or sell, as a solicitation of an offer to buy or see, or as a recommendation to buy, sell, hold or trade, any security or other financial instrument. THE IMPORTANT DISCLOSURES FOUND AT THE END OF THIS REPORT (WHICH INCLUDE DEFINITIONS OF CERTAIN TERMS USED IN THIS REPORT) ARE AN INTEGRAL PART OF THIS REPORT AND MUST BE READ IN CONJUNCTION WITH YOUR REVIEW OF THIS REPORT. Disclosure – YCharts
Share this
Stay Ahead with Smart Investments
Learn how to invest wisely and minimize risks to protect your retirement savings.

Achieve Your Retirement Goals
Get personalized advice to meet your retirement goals. Book your call with Destiny Capital now.