Markets and Economy Update – Sell in May, Go Away?
Throughout my career, I’ve come across many phrases and mantras (or cliches) that seem to have gained a permanent foothold among investment managers and media pundits alike. After the 2008 financial crisis, you couldn’t see a market update without someone referencing ‘the new normal’ and ‘climbing a wall of worry’ as investors navigated a period of low growth, low interest rates, and heightened fear. Other professionals might reference old phrases like ‘it’s time in the market, not timing the market’ or ‘don’t fight the Fed’. Another odd saying that I often heard very early in my career was ‘sell in May, go away’, which I always found to be a bit odd. Doesn’t that conflict with the ‘it’s time in the market, not timing the market’ mantra?
While there’s still a lot of time left in this month, if investors sold at the beginning of May 2024, they would’ve missed a bit of a market bounce after a dismal month of April. At the end of March, the S&P 500 and Dow Jones Industrial Average were each up roughly +10% and +6% year-to-date, respectively, on a total return basis. In our previous Markets & Economy letter and webinar after the conclusion of March, we spoke at length warning investors that ‘volatility is coming’. Normally, I love to be right, but not in cases like these, as we saw nearly all asset classes steadily decline throughout the month of April . By April 30th, we saw the S&P 500 end April up roughly +5.6% and the DJIA barely in positive territory at +1.1%.
What happened in April, and why have markets bounced back to start the month of May? Well, that’s exactly what we’ll be reviewing in this month’s letter and, for many of you, it’s a familiar story of angst and opportunity with inflation worries causing pessimism as corporate earnings offer hope.
Inflation, Housing & A Softening Labor Market
Based on some of the most recent data, inflation seems to be as sticky as my 3-year-old’s fingers after an ice cream cone. For nearly two years, we’ve pounded the drum stating that two things will need to happen in order to tame prices and return inflation back to the Fed’s 2% target. First, we’ll likely need to see softening in the labor market with fewer job openings, higher unemployment, and lower wage growth. Second, we’ll need to see home and rent prices decline to reduce the ‘stickiest’ element of inflation – the shelter index.
The Fed has one primary lever it can pull in order to impact shelter costs, and that lever is the fed funds target rate. By raising the fed funds target rate (aka interest rates), the Fed hoped that it would stall (or reverse) surging home prices. After all, higher interest rates equate to larger mortgage payments. Larger mortgage payments would impact affordability and cause sellers to lower prices. That seemed to be working for a time between mid-2022 and early 2023, as year-over-year growth declined in the Case Shiller 20 City Home Price Index, as seen below.

While the year-over-year decline in price growth is evident in the chart above, you can also see a reversal with the last Case Shiller 20 City Home Price Index indicating a +7.31% year-over-year price increase. This is above the +5.1% long-term average.
So, after a brief reversal in 2022, we’re now seeing home prices continue to rise at above average rates as housing affordability falls to levels not seen since 2006. This dynamic can be seen in the chart below with the Case Shiller Home Price Index in blue and the US Fixed Housing Affordability Index in orange.
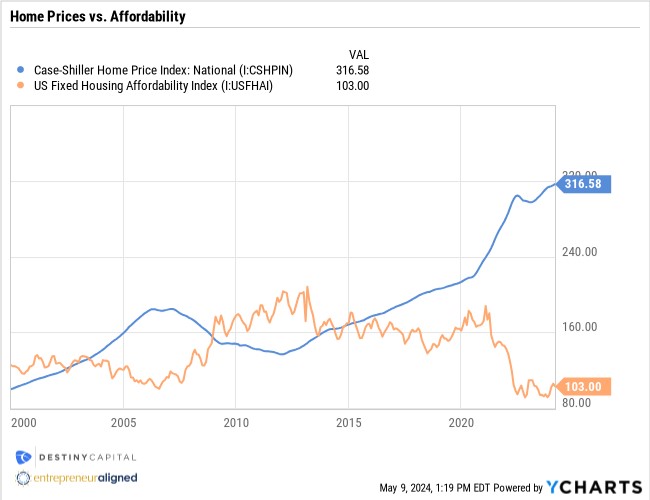
Given that the shelter index represents 33% of headline CPI and 42% of core CPI, these elevated housing costs continue to add to the owners equivalent rent (OER) element of inflation, making progress difficult in reaching the Fed’s 2% inflation target.
Given this data, we believe it’ll be challenging for inflation to decline back to the 2% target unless we see softening in the labor market. After all, if people have jobs, they can afford to make their mortgage or rent payment. If more people lose their jobs, then then less of them should be able to afford a mortgage payment or rent – at least at current levels. Hypothetically, this should reduce demand which should, in turn, cause housing prices to move lower.
The Labor Market – Are Cracks Developing?
Thus far, the U.S. economy has managed to absorb higher interest rates without causing the labor market to implode. However, we appear to be seeing some cracks in the labor market emerge based on some of the most recent reports. On May 1st, the Bureau of Labor Statistics released their Job Openings and Labor Turnover Survey (JOLTS) for March, which showed two things. One, it showed a continued decline in job openings with total nonfarm job openings falling to 8.4 million. Second, it showed that fewer people are quitting their jobs with quits coming-in at 3.3 million. For both of these data points, the declining trend is evident in the charts below.
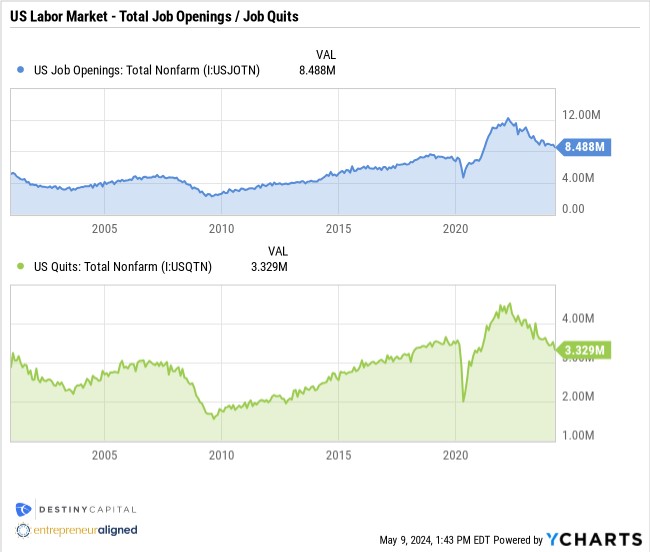
When jobs are plentiful and the labor market is strong, it’s not uncommon to see people job hop or resign in order to search for something better. However, when there are fewer jobs and the labor market is a bit shaky, we see less job mobility, and we’re starting to see that show up in the data.
Furthermore, on May 3rd, we received the Employment Situation Summary for April that showed the unemployment rate tick-up slightly from 3.8% to 3.9%. However, slightly more alarming was the non-farm payrolls report that showed 175,000 jobs were added in April vs. a consensus estimate of around 250,000. That report was actually received positively by investors, as a softening labor market could ultimately lead to lower inflation. Lower inflation could lead to lower interest rates, which is generally viewed as a good thing for the stock and bond markets.
However, one element of the labor market that caught investors a bit off guard was the US Employment Cost Index, which measures the change in total worker compensation, including wages, salaries, and benefits. Consensus estimates expected a year-over-year increase of roughly 3.9%, but investors grew worried when the BLS reported a year-over-year increase of 4.2%, and this led to a short-term selloff in the stock market.
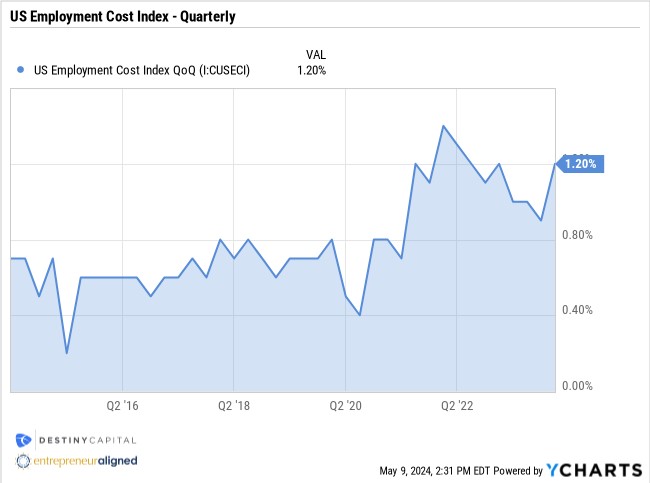
Another cliche that exists in the world of investments is ‘the trend is your friend.’ However, it’s important to note that what we’re seeing with the labor market isn’t necessarily a trend. One or two months of soft labor market data does not mean that we’re suddenly going to see the unemployment rate spike or jobs disappear. However, it’s important to note that we continue to track developments here, as the labor market could impact inflation and, subsequently, monetary policy which could affect investment allocation decisions for investors.
Earnings Update & A Case Study In Market Timing
What if someone told you that, prior to their recent Q2 earning’s report, Apple would reveal a -4.3% year-over-year decline in revenues. Furthermore, due to issues in the Chinese marketplace, they would also report a -10% decline in iPhone sales and provide weak forward guidance of low single-digit revenue growth in the quarter ahead.
Given this information, during the subsequent trading day, would you expect the stock price to rise, fall, or remain the same? Clearly this is hypothetical because none of us would make investment decisions based on material non-public data like this (that’s called ‘insider trading’). Still, I’d imagine that, given these ‘headlines’, most would assume that the stock price would either remain the same or fall, especially when markets are so hyper-sensitive to mega-cap companies like Apple. What happened when the Q2 report was released? You guessed it, the stock price rose roughly 6% during the next trading day.
Why? Well, there’s another way a corporation can boost the value of company stock – through share buybacks. During their Q2 earnings call, Apple executives announced that its board had authorized $110 billion in share repurchases, which is the largest buyback initiative in company history. Apple has a considerable cash pile so, over the past decade, the company has consistently repurchased shares, which has considerably lowered the number of shares outstanding. You can see this dynamic in the chart below.

Why are share buybacks so valuable to investors? With fewer shares, an investor’s fractional ownership of a company increases. Also, a key metric in measuring a company’s profitability is Earnings Per Share (EPS). The EPS calculation is (Net Income – Preferred Dividends) / Common Shares Outstanding. When there are fewer shares outstanding, then Earnings Per Share should increase (assuming net income doesn’t subsequently decline), while the Price-to-Earnings (P/E) Ration should decrease. Higher EPS and a lower P/E is something all investors would like to see.
The bottom line is that investors could have all the answers to the test ahead of time, but market reactions are impossible to predict. Another case and point, Meta Platforms (Facebook) reported revenues and earnings that both topped wall street estimates, yet the company’s stock fell -10% in the following trading day due to disappointing forward guidance on quarterly revenues. Go figure.
When it comes to the rest of the S&P 500, earnings have been strong. As-of this writing with over 80% of S&P 500 companies reporting earnings, we’ve seen 77% of these companies report a positive earnings per share (EPS) surprise, which is above the 10-year average. Right now, the earnings growth rate for the S&P 500 is 5.0% and, if this holds steady or increases, it will mark the highest year-over-year earnings growth rate since the 2nd quarter of 2022. Looking ahead, analysts are anticipating earnings growth rates of 9.6% for Q2, 8.4% for Q3, and 17.1% for Q4 of 2024.
Furthermore, after a period of belt-tightening by many of the large S&P 500 companies, we are seeing widening operating margins, as seen below. Widening margins are generally viewed positively by investors as a sign of stronger profitability and value.
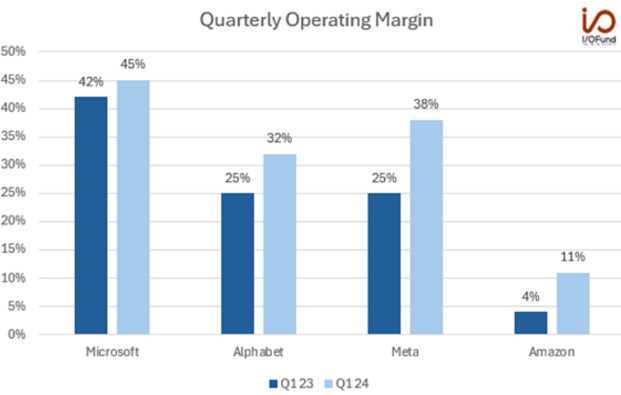
Source: Forbes.com, I/O Fund, Company Filings
Big tech is also accelerating investments into Artificial Intelligence (AI), with capital expenditures (Capex) increasing over 35% on a year-over-year basis. Estimates are for a $200 to $210 billion combined investment in AI-related expansion.
Ultimately, strong corporate earnings have helped to combat recent inflation fears, and markets have regained some of the ground that was lost in April, as you can see in the major index returns.
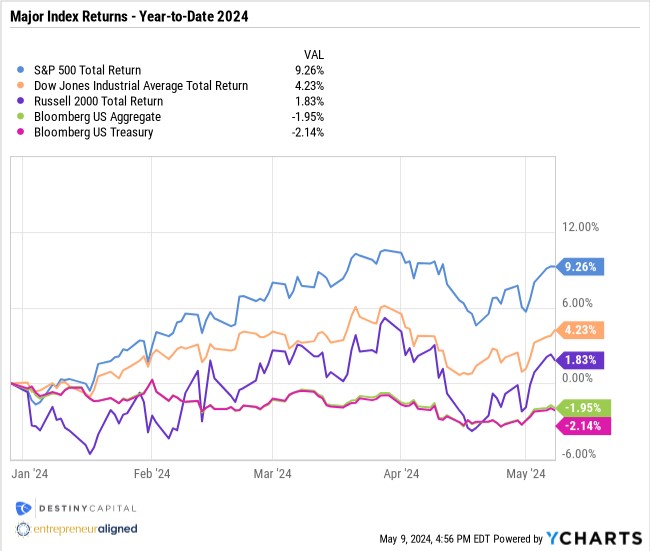
Sell in May? Not so fast. We still anticipate better days ahead for the bond markets, but bonds continue to be negatively impacted by whipsawing Fed policy and remain in negative territory year-to-date. Moving forward, as always, will be closely watching the May 15th CPI report. The Cleveland Fed is anticipating headline CPI of 3.50% and Core CPI of 3.65%, which would represent a lower core reading (excludes food & energy), but no change from the previous headline CPI reading. Then, about a month from now, we’ll get our next Fed meeting which, we hope, will give us more concrete guidance on interest rate policy.
In the meantime, we are quickly counting down to what we expect to be a very contentious election cycle where emotions will run high. In times like these, it’s important to remember that elections tend to have very little impact on financial markets. Could there be a reactionary move in the stock market based on the election result? I suppose so. However, at Destiny Capital, this is when we reflect on two of our core investing principles: Discipline and Data-Driven.
Discipline – we do not chase returns or seek to time the market. We adhere to our process, thesis and values even through the most difficult times.
Data Driven – decisions are based on objective data, not subjective emotions or gut feelings. Investment decisions based on emotion tend to lead to negative outcomes.
If, before or after the election, data indicates an economic environment that could impact financial markets, we will absolutely make portfolio adjustments that we believe are in the best interest of our clients. Until then, if you are concerned about your investments or outcomes that could arise from the election, please reach out to your team and we’d be happy to listen, learn, and share our perspective.
Important note and disclosure: This article is intended to be informational in nature; it should not be used as the basis for investment decisions. You should seek the advice of an investment professional who understands your particular situation before making any decisions. Investments are subject to risks, including loss of principal. Past returns are not indicative of future results. Advisory services provided by Destiny Capital Corporation, a registered investment adviser.
2024 YCharts, Inc. All Rights Reserved. YCharts, Inc. (“YCharts’) is not registered with the U.S. Securities and Exchange Commission (or with the securities regulatory authority or body of any state or any other jurisdiction) as an investment adviser, broker-dealer or in any other capacity, and does not purport to provide investment advice or make investment recommendations. This report has been generated using data manually input by the creator of this report combined with data and calculations from YCharts.com and is intended solely to assist you or your investment or other adviser(s) in conducting investment research. You should not construe this report as an offer to buy or sell, as a solicitation of an offer to buy or see, or as a recommendation to buy, sell, hold or trade, any security or other financial instrument. THE IMPORTANT DISCLOSURES FOUND AT THE END OF THIS REPORT (WHICH INCLUDE DEFINITIONS OF CERTAIN TERMS USED IN THIS REPORT) ARE AN INTEGRAL PART OF THIS REPORT AND MUST BE READ IN CONJUNCTION WITH YOUR REVIEW OF THIS REPORT. Disclosure – YCharts
Share this
Stay Ahead with Smart Investments
Learn how to invest wisely and minimize risks to protect your retirement savings.
Achieve Your Retirement Goals
Get personalized advice to meet your retirement goals. Book your call with Destiny Capital now.


