Markets and Economy – Headwinds on the Horizon?
by Tim Doyle, Chief Investment Officer, CFP®, MBA
Years ago, I joined a small group of three of my good friends for a day of boating on beautiful Lake Dillon in Summit County, Colorado. With coolers packed and fishing rods stowed, we launched in my buddy’s twenty-four foot motorboat from the Dillon marina and casually made our way south toward the town of Frisco and the Blue River Inlet. It was one of those stunningly beautiful blue-sky Colorado days that always made me wonder why anyone would want to be anywhere else in the world. We were all smiles and laughter as we fished, relaxed and retold old stories we’ve shared hundreds of times before.
Suddenly, just as we were approaching the southeastern most point of the lake, everything changed. In mere moments, the wind began to swirl and temperatures dropped dramatically as stark, grey clouds crested the mountains in the near distance. As the old saying goes in Colorado, “if you don’t like the weather – just wait a minute.” In less than fifteen minutes, our smiles had faded and we were passing around life preservers as our boat careened and breached through three-to-four foot swells. Inch by inch, we made our way in the general direction of Dillon marina as gusty headwinds made progress slow and daunting. Shivering and as soggy as our sandwiches, we eventually reached the marina and, at the very least, had an interesting story to tell our wives that evening.
Ever since markets began their ascent in mid-April, investor mindset has reminded me a lot of me and my boating pals as we coasted across glassy waters with barely a care in the world. However, much like weather in the Rocky Mountains, investors never quite know when an economic squall might appear that causes considerable headwinds for financial markets. We were reminded of this fact when economists and investors were blindsided by the July Employment Situation Summary (aka Jobs Report) released by the Bureau of Labor Statistics on August 1st. So, in this month’s investor letter, we’ll review exactly what that July jobs report means for investors before we delve into the ‘usual suspects’ like tariffs and interest rates before we close with a positive by reviewing corporate earnings and market returns.
A Suddenly Laboring Jobs Market?
On August 1st, the Bureau of Labor Statistics (BLS) released what most anticipated to be a normal, run-of-the-mill monthly jobs report. Instead, the July jobs report spurred alarming headlines across financial media outlets, a sudden selloff in the stock market, and even resulted in the immediate firing of BLS Commissioner, Erika McEntarfer, by President Trump. To quote Yosemite Sam, what in tarnation happened here?
Yes, at first glance, the jobs report appeared fairly innocuous with only 73,000 jobs added in July versus 110,000 expected by consensus estimates. Those types of misses are fairly common and, while not particularly encouraging, are hardly headline worthy. So, what caused such contention and controversy? Let’s break this down by first outlining what this jobs report is and what it is intended to measure.
The BLS releases its jobs report on the first Friday of every month, and this jobs report is officially referred to as the ‘Preliminary Estimate’ or ‘First Estimate’. The use of the word ‘estimate’ is crucial here. You see, this BLS jobs report is a survey of roughly 119,000 business and government agencies and is intended to measure, among other things, jobs gained or lost over the month in question. This survey is self-reported by the 119,000 businesses and government agencies that participate, and this jobs gained/lost figure is derived by the headcount reported by each participant.
For example, if ABC Corporation reports a headcount of 10,000 employees in June, then reports a headcount of 9,800 employees in July, then the BLS will assume that 200 jobs were lost in July. Extrapolate this info across all 119,000 respondents, and you’ve got your BLS jobs report (aka the Employment Situation Survey).
The problem is that not all respondents are timely in their survey responses, and participants can be late in reporting their monthly data. While there’s no stated deadline, the BLS typically has a cutoff date of the 12th of each month for the data to be used in the Preliminary Estimate. This is why the BLS always releases two more versions of the monthly jobs report with the “Second Estimate” produced a month after the original report, and the “Final Estimate” released a month after that.
In the report released on August 1st, economists and investors weren’t necessarily concerned about the 73,000 jobs added in July versus 110,000 expected, but with the revisions announced for the jobs numbers in both May and June. In the May jobs report, the BLS initially reported 144,000 jobs gained, then reported 147,000 jobs gained for the month of June. Those figures were subsequently revised down to 19,000 jobs added in May, and 14,000 jobs added in June based on revisions made due to survey responses. The magnitude of these revisions can be seen in the chart below that shows initial job gains in blue vs. revised job gains in red.

Source: The Bureau of Labor Statistics
In a single day, investors had to digest the fact that 258,000 fewer jobs were created in May and June than originally believed. Suddenly, the U.S. labor market went from solid and resilient to concerning.
As I mentioned earlier, revisions are a standard part of each monthly jobs report. Many key economic indicators like Gross Domestic Product, Retail Sales, Industrial Production, Job Openings & Labor Turnover, Housing Starts, and more are subject to ongoing revisions. However, in this case, the magnitude of each revision is what drew the ire of the Trump administration and resulted in the ousting of BLS Commissioner, Erika McEntarfer.
As an investment manager, is this significant revision frustrating? Of course it is, because we make investment decisions given the best data available to us at the time. However, I would consider this a case of the BLS working with incomplete data versus working with bad (or manipulated) data. Our focus then becomes, “what does this labor market data mean for investors?”, and that leads right into our next few topics including Fed monetary policy and U.S. trade policy.
Inflation, Trade & The Dual Mandate
As you may know by reading my investor letters each month, the Federal Reserve has a dual mandate – stable prices (aka – low inflation) and full employment. All monetary policy decisions are made with those two goals in mind. In 2021, aggregate prices began to rise in the United States as pandemic-related supply chain issues impacted the supply of goods, and significant fiscal & monetary stimulus boosted consumer demand.
Inflation rapidly became unchained and peaked at roughly 9% during the summer of 2022. Fortunately, the labor market remained incredibly resilient and the unemployment rate, after spiking in April of 2020, declined to sub-four percent levels by 2022, as you can see in the chart below.

The labor market remained incredibly (and surprisingly) resilient despite extremely restrictive monetary policy as the Fed raised interest rates higher and higher. This labor market resiliency made the Fed’s job much easier because their focus could remain on taming inflation and not boosting the labor market. Since then, the Fed has largely (and gradually) reduced year-over-year inflation closer to their 2% target while the unemployment rate has hovered around the 4% range for years.
However, investors and economists increasingly worry that the new trade policies of the United States – namely the implementation of tariffs – could push aggregate prices higher moving forward. In fact, the latest CPI report released on July 15th saw an uptick in both Headline and Core CPI, as you can see at the far right of the chart below.

In his post-Federal Open Market Committee (FOMC) meeting press conference on July 30th, Fed Chairman Jerome Powell referenced the impact of tariffs when he stated, “although the underlying composition of price changes has shifted: services inflation has continued to ease, while increased tariffs are pushing up prices in some categories of goods.”
As each day passes, investors are also seeing more and more ‘final’ tariff deals emerge between the United States and key trade partners across the globe. Many – if not all – of these tariffs are considerable, as you can see in the chart below that shows the effective new tariff rates of the top 10 trade partners of the United States.
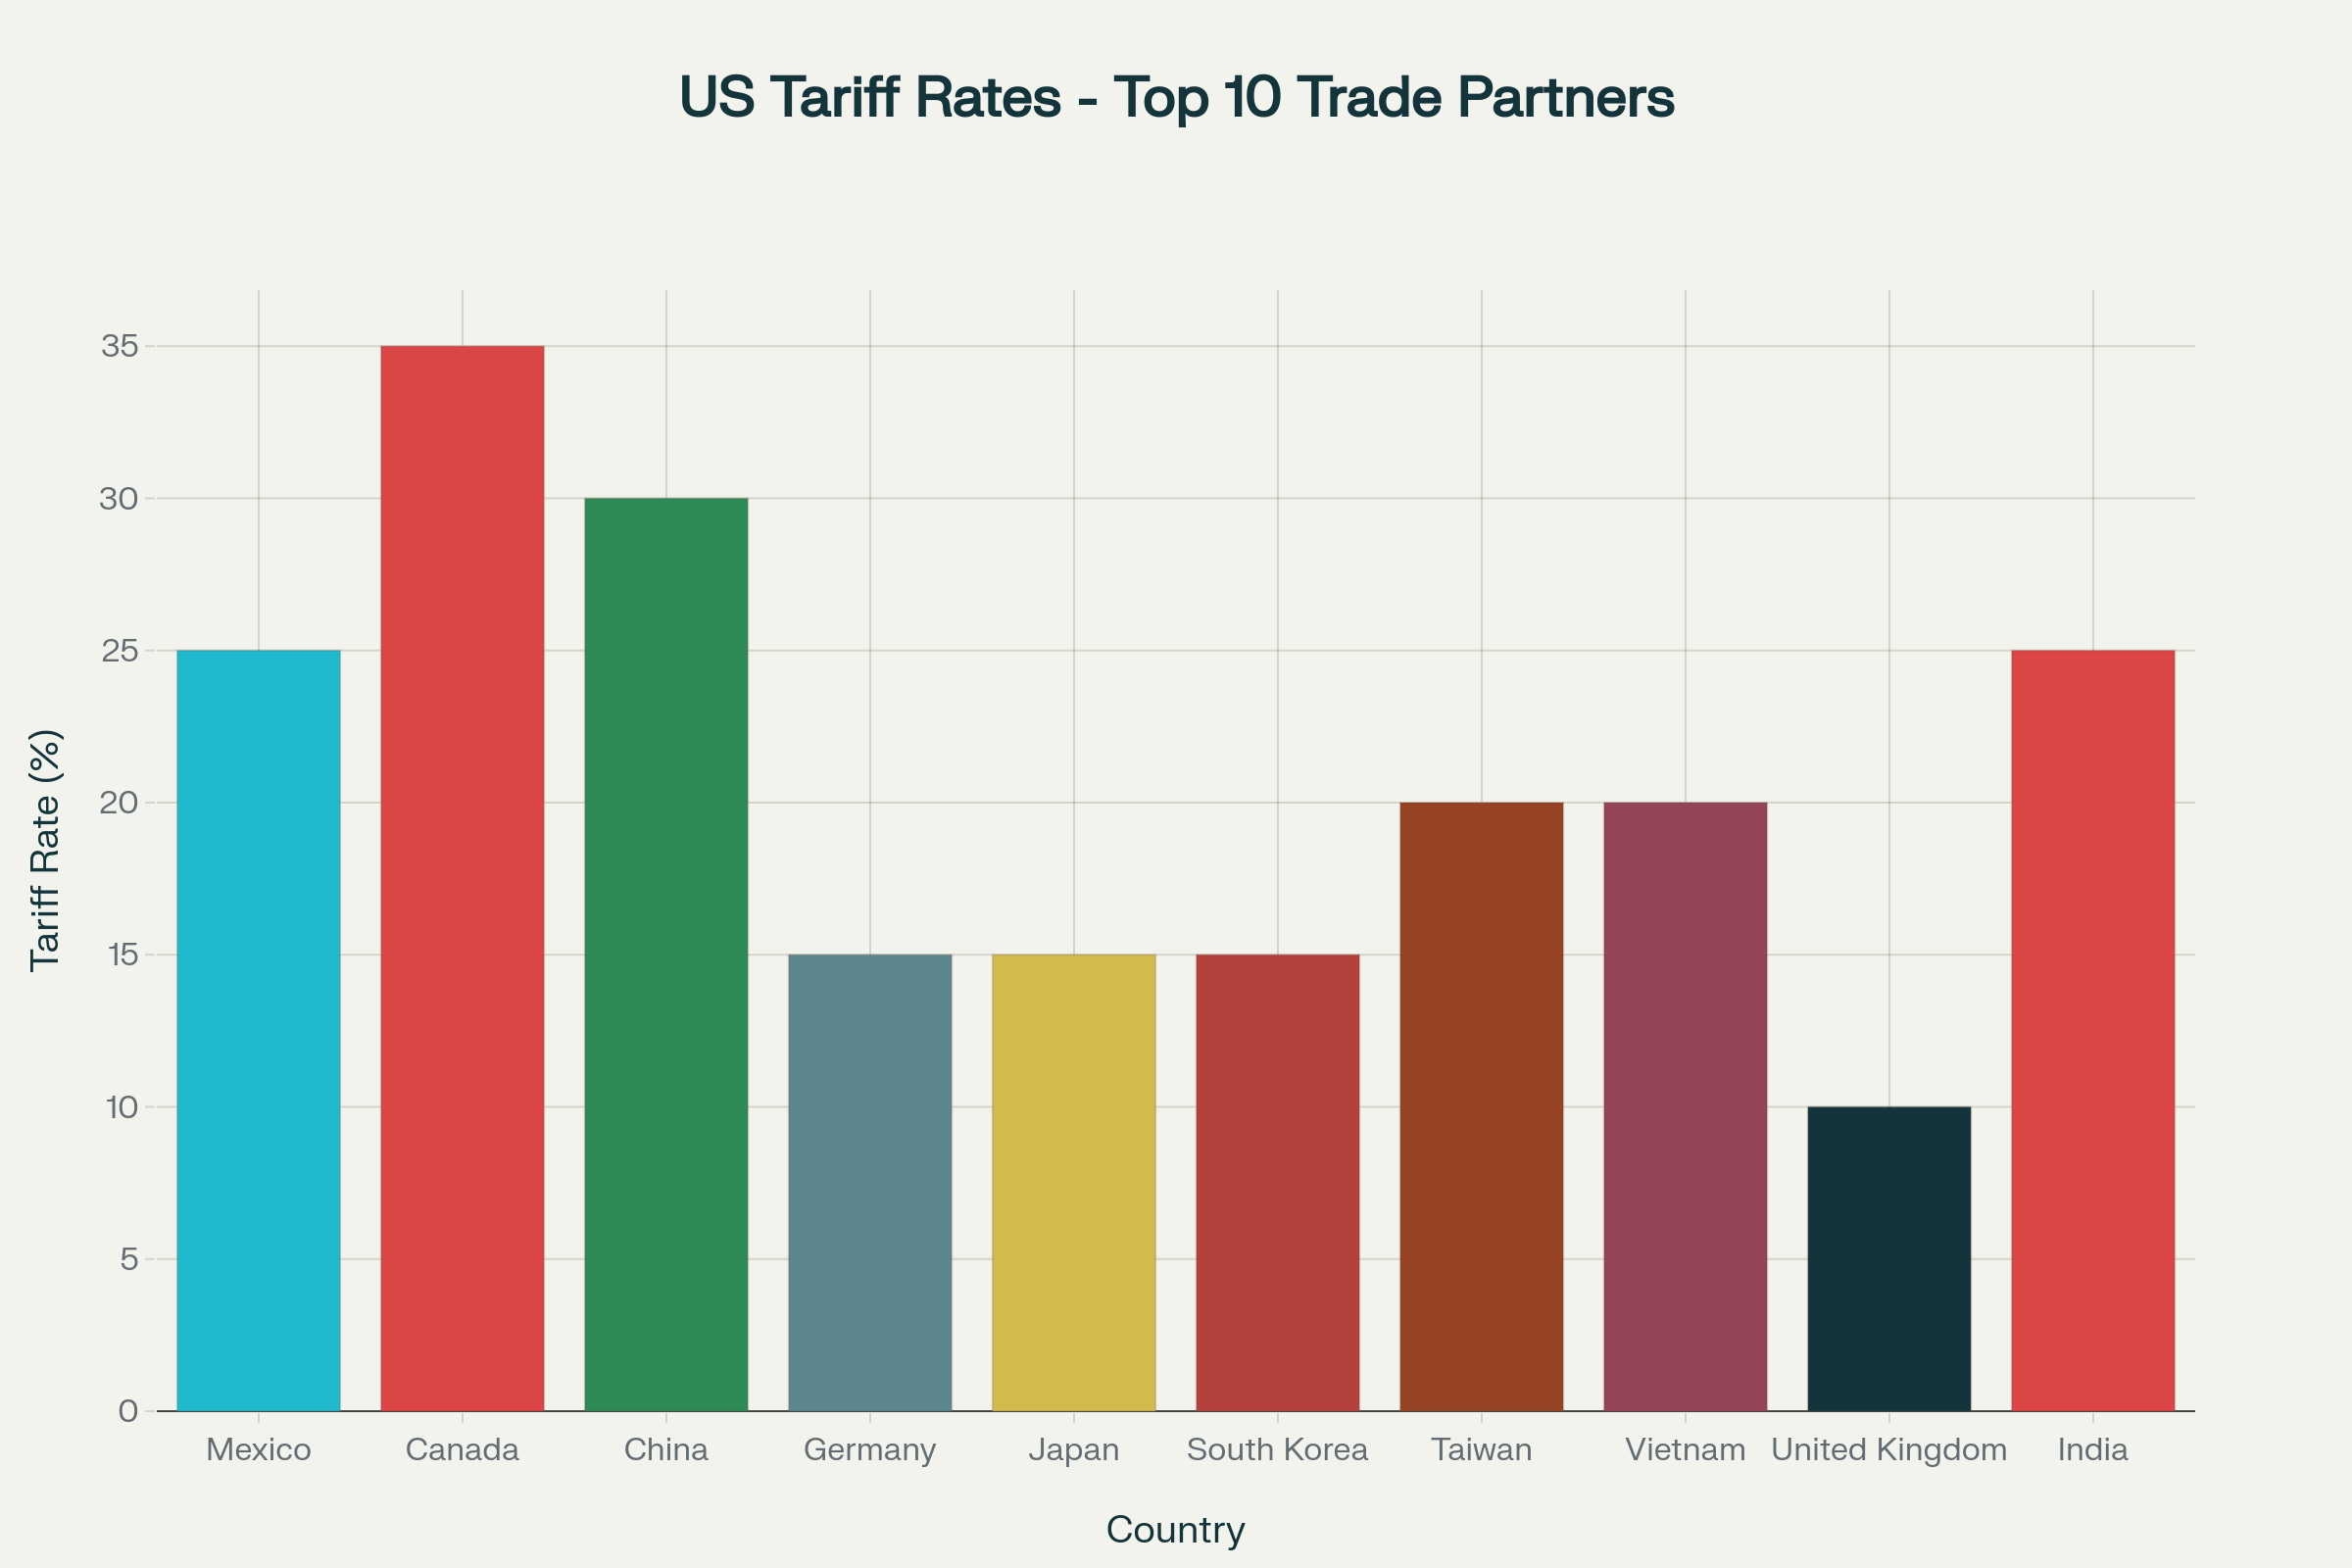
Source: whitehouse.gov, JP Morgan Asset Management, US International Trade Commission
I would like to stress that these tariff rates are subject to change and could be altered by the time this communication is published. In fact, as I write this, there is talk of tariffs on Indian goods reaching 50% due to the country’s imports of Russian oil and gas.
The bottom line is that it appears as though tariffs are here to stay and that they are likely to be considerable. In fact, based on the most up-to-date trade deals, the weighted average tariff on foreign imports is 16.3% – levels not since the late 1930’s as you can see in the chart below.
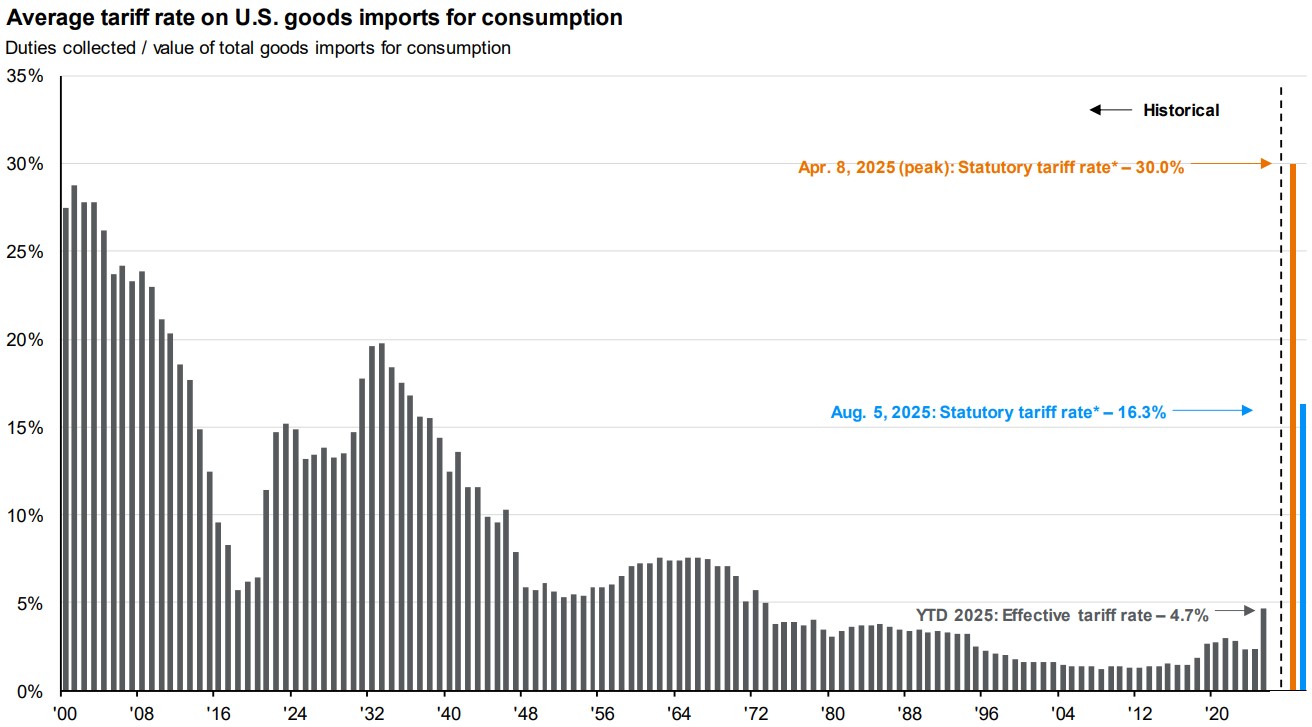
Source: JP Morgan Asset Management Guide to the Markets
Therefore, probabilities are increasing that aggregate prices (inflation) will move higher as U.S. consumers absorb at least some of the tariff-related price increases moving forward. Also, let’s not forget the recent tax bill which has the potential to stimulate the economy and boost consumer demand which could also cause prices to inch higher.
The Fed’s Potential Dilemma
Prior to August 1st, the Federal Reserve could maintain its focus on combating inflation because the labor market had remained incredibly resilient. However, do the steep, downward revisions of the May and June jobs numbers change the Fed’s calculus? Does the Fed suddenly need to consider (or even prioritize) the labor market when making policy decisions given this new data? If so, which mandate takes precedence?
To boost the labor market, the Fed would need to cut interest rates. Yes, lower interest rates could stimulate the economy and potentially boost hiring, but it could also push prices higher as the economy heats up.
To further lower inflation, the Fed would need to either increase interest rates or keep rates higher for longer. Restrictively high interest rates could weaken the economy and potentially boost layoffs and negatively impact the suddenly shaky labor market. As you can see, in the near future, the Fed’s two mandates may come in conflict with one another and the FOMC may need to sacrifice one mandate in order to benefit the other. That will be an interesting tightrope for the Fed to traverse.
Somewhat ironically, the downwardly revised job numbers may actually help President Trump in his goal of lowering interest rates as a 0.25% rate cut is all but guaranteed in September due to the weakened jobs numbers. Investors are assigning a 94% probability to a 0.25% rate cut on September 17th.
Beyond that initial cut, my belief is that the Fed will continue to prioritize inflation and will proceed with caution by not lowering interest rates too quickly. We all experienced how impactful and damaging inflation can be when it comes to purchasing power, and I firmly believe that the Fed sees inflation as a greater economic peril than a temporary spike in the unemployment rate.
Regardless, the United States is re-inventing the rules of global trade, so there is bound to be some uncertainty in the months ahead. Fortunately, in the meantime, financial markets remain bolstered by strong corporate earnings which have pushed markets higher in recent weeks.
Market Returns & Strong Corporate Earnings
While uncertainty abounds across the global economy, investors remain encouraged by strong 2nd quarter (Q2) corporate earnings. This has boosted year-to-date returns for major market indexes like the S&P 500, Dow Jones Industrial Average, the Russell 2000 (small caps) and the Bloomberg U.S. Aggregate Bond Index, as you can see in the chart below.

In fact, since the three major stock market indexes bottomed-out on April 8th, they have experienced a rebound with returns between April 8th and August 5th illustrated below:
S&P 500: +26.9%
Dow Jones Industrial Average: +17.7%
Russell 2000: +26.9%
In our opinion, that’s an absolutely extraordinary recovery. Why have investors grown so optimistic? Well, equity investors tend to react positively to fiscal stimulus like the One Big Beautiful Bill because it can put a few more dollars in the pockets of American consumers. So, even before the final tax bill was signed on July 4th, investors began to price-in the positive benefits of tax cuts.
Furthermore, stock market investors tend to like lower interest rates because, like tax cuts, they have the potential to stimulate economic growth by, among other things, reducing the cost of borrowing for businesses and consumers alike. So, while the revisions announced in the August 1st jobs report might be concerning overall, investors believe that the weaker jobs numbers will cement at least one rate cut beginning in September of 2025, as I’ve indicated previously.
Perhaps most importantly for investors, it’s crucial to note that Q2 corporate earnings have been very strong. In fact, as of this writing, over 82% of S&P 500 companies have reported a positive earnings surprise while 79% of companies have exceeded revenue estimates. Both of these figures are well-above the five and ten year averages.
When it comes to year-over-year earnings growth, the blended earnings growth rate of the S&P 500 is +10.3%. This figure is well above the projected earnings growth rate of roughly 5% and, if this figure holds, it will represent the third consecutive quarter of double-digit earnings growth for the S&P 500 index.
Earnings growth is being driven by the Communications Services, Technology and Financials sectors as you can see in the chart below. For example, the Communications Services sector was expected to see earnings growth of 29.4%, but actual results show earnings growth for the sector at 40.7%. Clearly, that level of earnings growth can be encouraging for investors.

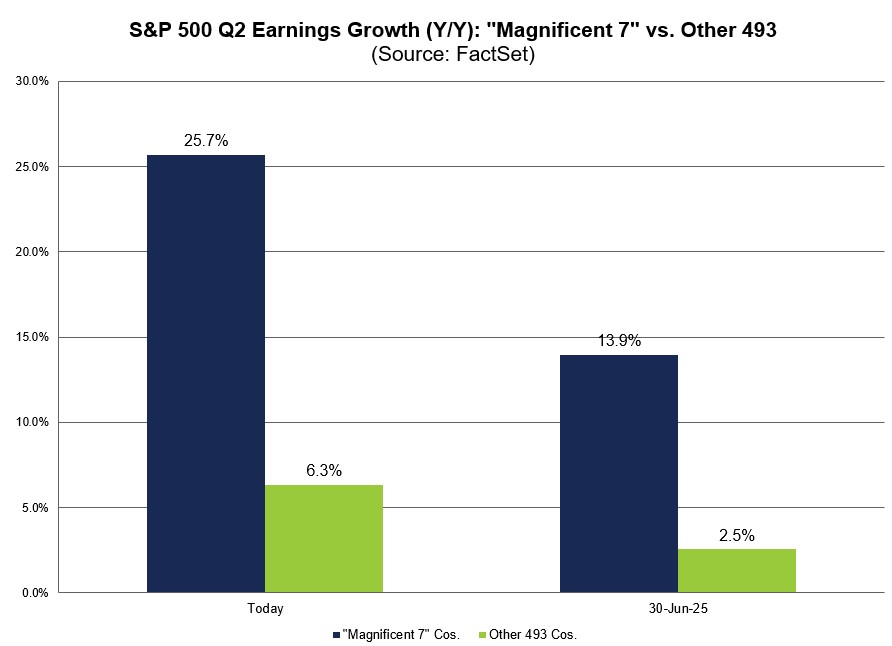
Furthermore, markets are once again being driven by the Magnificent 7 stocks – Alphabet, Amazon, Apple, Meta, Microsoft, NVIDIA and Tesla – as their earnings growth continues to vastly outpace the rest of the S&P 500 as you can see in the chart below. However, it’s important to note that even the rest of the S&P 500 (the ‘other’ 493 companies) have surpassed earnings growth estimates with a blended growth rate of 6.3% vs. 2.5% expected prior to earnings season.
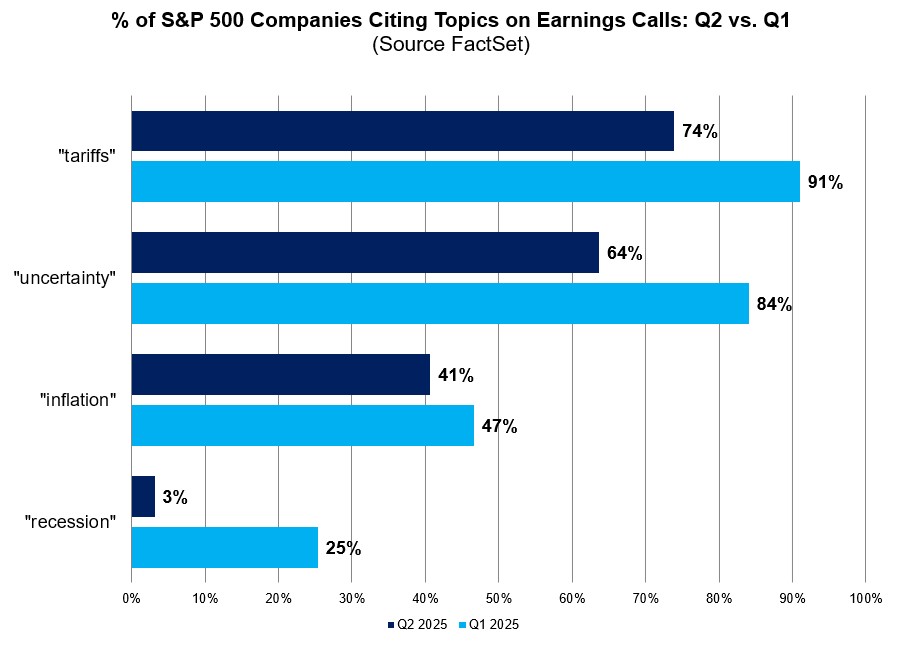
Yes, there remains a tremendous amount of uncertainty around tariffs, inflation, federal spending and debt, the labor market, artificial intelligence and so forth. In fact, so far in Q2 earnings season, 94% of S&P 500 companies have cited the impact of “tariffs” during earnings calls, while the word “uncertainty” was referenced during 84% of earnings calls.
However, this is nothing new. Uncertainty is a constant for investors and, as I’ve said many times over the past five years, financial markets tend to ‘find a way’ despite seemingly impossible obstacles. When purchasing stocks, investors demand a ‘risk premium’. This premium is the reward that investors earn for taking additional risk, and volatility is the price of admission. Are there potential headwinds facing the U.S. economy and financial markets? Of course, but that doesn’t make this any different than any other period of time over the past three, five or even ten years. As we’ve always done here at Destiny Capital, we’ll attempt to navigate our investors through this uncertainty while communicating with you every step of the way to let you know how we view the investing landscape and what it might mean for you and your financial goals.
Important note and disclosure: This article is intended to be informational in nature; it should not be used as the basis for investment decisions. You should seek the advice of an investment professional who understands your particular situation before making any decisions. Investments are subject to risks, including loss of principal. Past returns are not indicative of future results. Advisory services offered through Destiny Capital Corporation, an Investment Adviser registered with the U.S. Securities & Exchange Commission.
2024 YCharts, Inc. All Rights Reserved. YCharts, Inc. (“YCharts’) is not registered with the U.S. Securities and Exchange Commission (or with the securities regulatory authority or body of any state or any other jurisdiction) as an investment adviser, broker-dealer or in any other capacity, and does not purport to provide investment advice or make investment recommendations. This report has been generated using data manually input by the creator of this report combined with data and calculations from YCharts.com and is intended solely to assist you or your investment or other adviser(s) in conducting investment research. You should not construe this report as an offer to buy or sell, as a solicitation of an offer to buy or see, or as a recommendation to buy, sell, hold or trade, any security or other financial instrument. THE IMPORTANT DISCLOSURES FOUND AT THE END OF THIS REPORT (WHICH INCLUDE DEFINITIONS OF CERTAIN TERMS USED IN THIS REPORT) ARE AN INTEGRAL PART OF THIS REPORT AND MUST BE READ IN CONJUNCTION WITH YOUR REVIEW OF THIS REPORT. Disclosure – YCharts
Share this
Stay Ahead with Smart Investments
Learn how to invest wisely and minimize risks to protect your retirement savings.

Achieve Your Retirement Goals
Get personalized advice to meet your retirement goals. Book your call with Destiny Capital now.